Download
1 / 19
200 likes | 293 Views
Lecture Unit 1 Stats Starts Here. Objectives: be able to – Identify the Who, What, Why, When, Where and How associated with data Identify different types of data variables. Statistics: An Overview. Everyday experiences:

E N D
Lecture Unit 1Stats Starts Here Objectives: be able to – • Identify the Who, What, Why, When, Where and How associated with data • Identify different types of data variables
Statistics: An Overview • Everyday experiences: Gallup polls, newspaper articles, lotteries, CPI, unemployment data, your admittance to NCSU (predicted GPA) Basic stock data Increasing in importance; used in more and more ways in many disciplines NY Times: Statistics
Broad Definition Many disciplines can be summarized in a few words: • Economics is about … Money (and why it is good) • Psychology: Why we think what we think • Biology: Life • Anthropology: Who? • History: What, where, and when? • Philosophy: Why? • Engineering: How? • Accounting: How much? • Statistics is about … Variation The discipline of Statistics deals with the efficient collection and the analysis of data to solve real-world problems in the presence of variability.
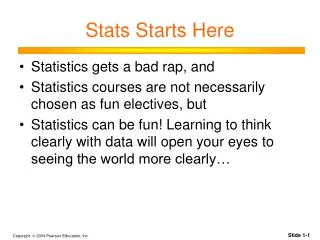
More Specifically … A. Statistics is a way of reasoning, along with a set of tools and methods, designed to help us understand the world. Q. What is Statistics? Q. What are statistics? A. statistics are quantities calculated from data.
2 Broad Areas of Applications • Descriptive statistics utilizes numerical and graphical methods to summarize data, look for patterns and trends, present information Descriptive statistics lack a measure of reliability
Second Area • Inferential statistics Uses data to make estimates, decisions, predictions or other generalizations about a larger data set or population • Inferential statistics have a measure of reliability Opinion Polling
Common Situations thatRequire Statistics • An opinion poll wants to know what fraction of the public approves of the president’s performance in office. • Will a new package design increase sales enough to pay the cost of implementing the new design Tropicana Disaster • Gov’t economists release monthly reports about the nation’s economic activity • Large groups of people or things • Time, cost, inconvenience
Three Simple Steps to Doing Statistics Correctly Planfirst. Know where you’re headed and why. Do. The mechanics of calculating statistics and making graphical displays are important, but the computations are usually the least important part of the process. Reportwhat you’ve learned. 8
SECTION 1.2 Types of Data Data: numbers with a context
Data: values and their context • 815, 930, 750, 919 • What can you do with these? • Find the sum? Find the average? Seems reasonable if these are, for example, SAT scores. • BUT these are telephone area codes! Adding and averaging make no sense.
Know the context of the data • Who: items included in the data • What: variable(s) measured on each item • Why: purpose for collecting the data -------------------------------- • Where: location(s) where data collected • When: last week? 1 year ago? last decade? • How: internet survey? (worthless); data provided by gov’t agency? (useful)
Data Types • Qualitative Data Data that categorizes Ex. Male/female, Democrat/Republican, yes/no, Chevy/Buick/Pontiac/Oldsmobile, Awful/Fair/Good/Very Good/Excellent 1a) Nominal (categorical): categorizes only Buick, Chevy, Pontiac 1b) Ordinal: categories can be ranked or ordered taste test; order of finish in a race
DataTypes (cont.) • Wendy’s is developing a new hamburger. A panel of taste-testers evaluates the new item. Categories: Excellent Very Good Good Poor Gag Ordinal - there is a natural ranking
DataTypes (cont.) • Wendy’s is developing a new hamburger. A panel of taste-testers evaluates the new item. Categories: Excellent = 5 Very Good = 4 Good = 3 Poor = 2 Gag = 1 Ordinal - there is a natural ranking
Data Type Dictates Statistical Procedures • Quantitative data Data that is measured on a numerical scale Ex. height, GPA, income, temperature, SAT 2a) interval data no meaningful zero point; difference between 2 values meaningful; cannot meaningfully multiply or divide Ex. temperature, SAT
DataTypes Ex. (cont.) 60o F not twice as warm as 30o F; the difference between 32o and 30o same as difference between 83o and 810, 2 degrees in each case. (No meaningful “zero”; 0 degrees not the absence of all heat) • Ratio data zero point meaningful; can multiply and divide Ex. income, height, GPA, pulse rate; $200 is twice as much as $100; $0 is the absence of all money
We collect these data from 50 students. Which variable is categorical? • Eye color • Head circumference • Hours of homework last week • Number of TV sets in home 10
Registration and Records collects data on NCSU students. Which one of the following is quantitative? • Class ( freshman, sophomore, etc.) • Grade point average • Whether the student took an AP class • Whether the student has taken the SAT 10