Download
1 / 1
10 likes | 121 Views
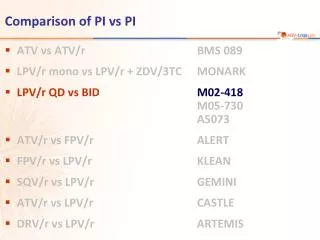
Identifying Long Period Variable (LPV) Stars Using Images from the Star Dial Observatory. Vanessa Friedman 1 , Jim Bedient 2 , Pebble Richwine 3 , Tim Slater 4 1 STARBASE DOD (Tucson, AZ) 2 U. Hawaii 3 Riverwatch Middle School (Suwanee, GA) 4 U. Wyoming. Introduction

E N D
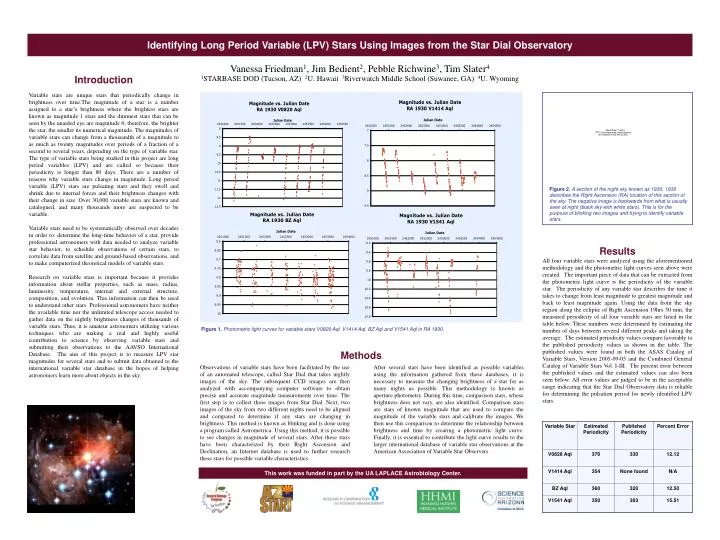
Identifying Long Period Variable (LPV) Stars Using Images from the Star Dial Observatory Vanessa Friedman1, Jim Bedient2, Pebble Richwine3, Tim Slater4 1STARBASE DOD (Tucson, AZ) 2U. Hawaii 3Riverwatch Middle School (Suwanee, GA) 4U. Wyoming Introduction Variable stars are unique stars that periodically change in brightness over time.The magnitude of a star is a number assigned to a star’s brightness where the brightest stars are known as magnitude 1 stars and the dimmest stars that can be seen by the unaided eye are magnitude 6; therefore, the brighter the star, the smaller its numerical magnitude. The magnitudes of variable stars can change from a thousandth of a magnitude to as much as twenty magnitudes over periods of a fraction of a second to several years, depending on the type of variable star. The type of variable stars being studied in this project are long period variables (LPV) and are called so because their periodicity is longer than 80 days. There are a number of reasons why variable stars change in magnitude. Long period variable (LPV) stars are pulsating stars and they swell and shrink due to internal forces and their brightness changes with their change in size. Over 30,000 variable stars are known and catalogued, and many thousands more are suspected to be variable. Variable stars need to be systematically observed over decades in order to: determine the long-time behavior of a star, provide professional astronomers with data needed to analyze variable star behavior, to schedule observations of certain stars, to correlate data from satellite and ground-based observations, and to make computerized theoretical models of variable stars. Research on variable stars is important because it provides information about stellar properties, such as mass, radius, luminosity, temperature, internal and external structure, composition, and evolution. This information can then be used to understand other stars. Professional astronomers have neither the available time nor the unlimited telescope access needed to gather data on the nightly brightness changes of thousands of variable stars. Thus, it is amateur astronomers utilizing various techniques who are making a real and highly useful contribution to science by observing variable stars and submitting their observations to the AAVSO International Database. The aim of this project is to measure LPV star magnitudes for several stars and to submit data obtained to the international variable star database in the hopes of helping astronomers learn more about objects in the sky. Figure 2.A section of the night sky known as 1930. 1930 describes the Right Ascension (RA) location of this section of the sky. The negative image is backwards from what is usually seen at night (black sky with white stars). This is for the purpose of blinking two images and trying to identify variable stars. Results All four variable stars were analyzed using the aforementioned methodology and the photometric light curves seen above were created. The important piece of data that can be extracted from the photometric light curve is the periodicity of the variable star. The periodicity of any variable star describes the time it takes to change from least magnitude to greatest magnitude and back to least magnitude again. Using the data from the sky region along the ecliptic of Right Ascension 19hrs 30 min, the measured periodicity of all four variable stars are listed in the table below. These numbers were determined by estimating the number of days between several different peaks and taking the average. The estimated periodicity values compare favorably to the published periodicity values as shown in the table. The published values were found in both the ASAS Catalog of Variable Stars, Version 2005-09-05 and the Combined General Catalog of Variable Stars Vol. I-III. The percent error between the published values and the estimated values can also been seen below. All error values are judged to be in the acceptable range indicating that the Star Dial Observatory data is reliable for determining the pulsation period for newly identified LPV stars. Figure 1.Photometric light curves for variable stars V0820 Aql, V1414 Aql, BZ Aql and V1541 Aql in RA 1930. Methods Observations of variable stars have been facilitated by the use of an automated telescope, called Star Dial that takes nightly images of the sky. The subsequent CCD images are then analyzed with accompanying computer software to obtain precise and accurate magnitude measurements over time. The first step is to collect these images from Star Dial. Next, two images of the sky from two different nights need to be aligned and compared to determine if any stars are changing in brightness. This method is known as blinking and is done using a program called Astrometrica. Using this method, it is possible to see changes in magnitude of several stars. After these stars have been characterized by their Right Ascension and Declination, an Internet database is used to further research these stars for possible variable characteristics. After several stars have been identified as possible variables using the information gathered from these databases, it is necessary to measure the changing brightness of a star for as many nights as possible. This methodology is known as aperture photometry. During this time, comparison stars, whose brightness does not vary, are also identified. Comparison stars are stars of known magnitude that are used to compare the magnitude of the variable stars and calibrate the images. We then use this comparison to determine the relationship between brightness and time by creating a photometric light curve. Finally, it is essential to contribute the light curve results to the larger international database of variable star observations at the American Association of Variable Star Observers. This work was funded in part by the UA LAPLACE Astrobiology Center.