Download
1 / 58
590 likes | 881 Views
Demand Chain Solutions Value Stream Mapping Jason Fretz Brian Grannan Aaron Lininger Jeff Lovell. Customer. Weekly Order. X. pcs. / month. Rolling 6-wk Forecast. Std Pack Qty. PC & L. 6-wk forecast. Steel Supplier. # Shifts. Level Box. DA1. Daily. DA2. DA3. 6 x / Day.

E N D
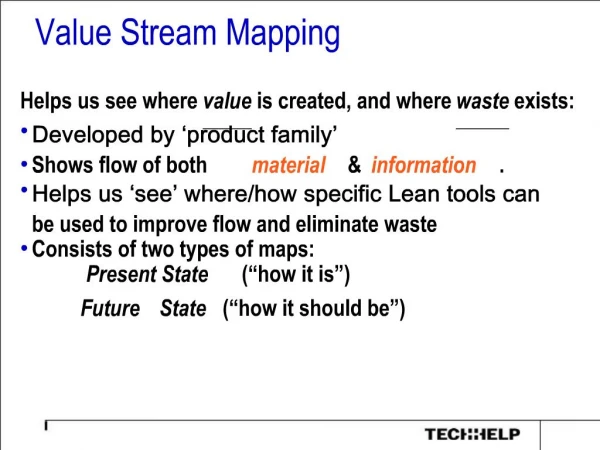
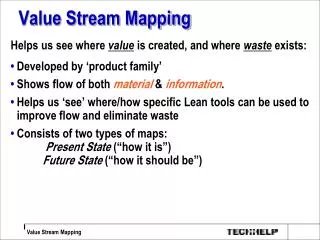
Demand Chain Solutions Value Stream Mapping Jason Fretz Brian Grannan Aaron Lininger Jeff Lovell
Customer Weekly Order X pcs / month Rolling 6-wk Forecast Std Pack Qty PC & L 6-wk forecast Steel Supplier # Shifts Level Box DA1 Daily DA2 DA3 6 x / Day Assembly Finished Goods Stamping Welding Layout # Material Handlers 3 Shifts 3 Shifts 3 Shifts TAKT Time TAKT Time TAKT Time Max Size CT = CT = CT = 2 Shifts C/O Time = C/O Time = C/O Time = 0 Overtime DT = DT = DT = Eyes for Waste . . . . . . Eyes for Flow Scrap = Scrap / Rework= Scrap / Rework = WIP = Small Lot # Operators WIP = WIP = .Time Inv ? days ? days ? days ? days TPc /t = ? ? days ? days .Time ? days Proc Lean Implementation Why do Value Stream Mapping? Implementation without a plan will lead to disaster A Value Stream Map is a simple picture that helps you focus on flow and eliminate the waste MAP THE FLOWS ! 8 3
Objectives • Explain Value Stream Mapping • Complete a Current State Value Stream Map • Complete a Future State Value Stream Map with proposed Implementation Plan
Agenda Introduction to Value Stream Mapping Current State Map Data Collection Activity: Map Current State • Review Current State Map • Design Future State • Future State Map • Consider Key Questions • Summary • Activity: Design Future State Session1 Session2
Agenda - Session 1 • Introduction to Value Stream Mapping • Current State Map • Data Collection • Activity: Map Current State
next Design Parts Manufacturing Raw Materials Requirements Distribution Assembly Plants Customer Introduction to Value Stream Mapping Definition of Value Stream A Value Stream includes all elements (both value added and non-value added) that occur to a given product from its inception through delivery to the customer. 8 2
VALUE STREAM PROCESS PROCESS PROCESS Stamping Welding Assembly Cell Introduction to Value Stream Mapping Definition of Value Stream Typically we examine the value stream from raw materials to finished goods within a plant. Raw Material Finished Product It is also possible to map business processes using Value Stream Mapping. 8 1
Customer Weekly Order X pcs / month Rolling 6-wk Forecast Std Pack Qty PC & L 6-wk forecast Steel Supplier # Shifts Level Box DA1 Daily DA2 DA3 6 x / Day Assembly Finished Goods Stamping Welding Layout 3 Shifts 3 Shifts 3 Shifts # Material Handlers TAKT Time TAKT Time TAKT Time Max Size CT = CT = CT = 2 Shifts C/O Time = C/O Time = C/O Time = 0 Overtime DT = DT = DT = Scrap = Scrap / Rework= Scrap / Rework = WIP = Small Lot # Operators WIP = WIP = Inv .Time ? days ? days ? days ? days TPc /t = ? ? days ? days Proc .Time ? days Future State Material, Information and Process Flowswith total Product Cycle Time Introduction to Value Stream Mapping Definition of Value Stream Mapping Value Stream Mapping (VSM) is a hands-on process to create a graphical representation of the process, material and information flows within a value stream.
Introduction to Value Stream Mapping Objectives of Value Stream Mapping • Provide the means to see the material, process and information flows. • Support the prioritization of continuous improvement activities at the value stream • Provide the basis for facility layout AND... Eliminate Waste 8 1
PLAN DO Future Current Customer 6 Week Rolling Forecast MRP MSS Weekly Order X pcs /month Customer Std. Pack Qty. PC & L Weekly Order Weekly Order 6 Week Rolling Forecast X pcs / month Rolling 6-wk Forecast # shifts Std Pack Qty Weekly Build Schedule Daily Ship 6-wk forecast PC & L Steel Supplier Steel # Shifts Schedule Supplier Tues. & Fri. Level Box # times/day DA1 Daily DA2 DA3 6 x / Day I Welding 1999 2000 Finished Goods I I I Steel Activity Layout Pin Stamping # pcs Assembly 1ST 2ND 3RD 4TH 1ST 2ND 3RD 4TH # days or shifts Layout Assembly Finished Goods Stamping Welding Establish TAKT & Flow in Tank Ass'y Layout TAKT = TAKT = TAKT = # Shifts = Stamping Changeover Reduction 2 Shifts # Operators Cycle Time = Overtime = Changeover Time=4 hr Cycle Time = WIP = Reduce Stamping Buffer 3 Shifts 3 Shifts 3 Shifts # Material Handlers DT, Scrap Downtime Scrap/Rework = 10% Rework TAKT Time TAKT Time TAKT Time Max Size Downtime = 20% 2 Presses Changeover Time = Move Ass'y to Plant 10 CT = CT = CT = 2 Shifts Cycle Time = WIP = WIP = C/O Time = C/O Time = C/O Time = 0 Overtime Establish TAKT & Flow in Sender Ass'y WIP = DT = DT = DT = Scrap Change Scrap = Scrap / Rework= Scrap / Rework = Over Pull To Sender Ass'y Inventory Time ? days ? days ? days ? days WIP = Small Lot # Operators Uptime TPc /t = ? Processing Time ? days ? days ? days WIP = WIP = Inv .Time ? days ? days ? days ? days TPc /t = ? ? days ? days Proc .Time ? days Training Introduction to Value Stream Mapping The Process Map the Current State Analyze the Current State andDesign the Future State Create an implementation plan and execute it ! 8 4
Agenda - Session 1 • Introduction to Value Stream Mapping • Current State Map • Data Collection • Activity: Map Current State
Step 1: Step 2: Step 3: Step 4: Step 5: Step 6: Step 7: Step 8: Current State Map The Steps Select a Product Family Form a Team Understand Customer Demand Map the Process Flow Map the Material Flow Map the Information Flow Calculate Total Product Cycle Time Detail Off-Line Activities
Current State Map Step 1: Select a Value Stream (Product Family) • Define value stream (product family) • Identify value stream from the customer end • Product should pass through similar processes and common equipment • Door-to-door in scope (within plant walls) • List part numbers
Industrial Engineering Sensei Product Engineering Manufacturing Cross Functional Team Maintenance PC & L Leadership THIS IS CRITICAL Current State Step 2: Form a Team • Select a cross-functional team • Select team members who are familiar withthe product • Ensure that teammembers are trained in theuse of VSM • Designate a champion (typically a line manager) 8 4
Customer Demand/month: Part A = Part B = Part C = # of shifts = Current State Map Step 3: Understand Customer Demand • Plan for Every Part • Production Control (monthly/weekly forecasts) • Production history (day-to-day, month-to-month variation) • Sales (product changes, new business, etc.) 8 1
Demand/month: Part A = Part B = Part C = # of shifts = Current State Map Customer Stamping Welding Assembly Shipping Takt = Takt = Takt = Inventory C.T. = C.T. = C.T. = Part A = D.T. = D.T. = 20% D.T. = Part B = FTQ = FTQ = FTQ = 90% Part C = C/O Time = 4 hrs. C/O Time = C/O Time = # of shifts = Lot Size = Lot Size = Lot Size = # of Shifts # of Shifts # of Shifts WIP = WIP = WIP = Changeover FTQ Downtime
Customer Supplier 2 x/ week 2 x/ day I I I I 500 pcs 1,200 pcs 800 pcs 1,500 pcs Inventory Part A = Part B = Part C = # of shifts = Changeover FTQ Downtime Current State Map Step 5: Map the Material Flow Demand/month: Part A = Part B = Part C = # of shifts = Shipping Stamping Welding Assembly Takt = Takt = Takt = C.T. = C.T. = C.T. = D.T. = D.T. = 20% D.T. = FTQ = FTQ = FTQ = 90% C/O Time = 4 hrs. C/O Time = C/O Time = Lot Size = Lot Size = Lot Size = # of Shifts # of Shifts # of Shifts WIP = WIP = WIP =
PC & L 6 week rolling forecast Weekly Order 6 week rolling forecast Weekly Order Daily Ship Schedule 2 x/ day Weekly Build Schedule Changeover FTQ Downtime Current State Map Customer Step 6: Map the Information Flow Supplier Demand/month: Part A = 705 pcs. Part B = 600 pcs. Part C = 1650 pcs. # of shifts = 2 x/ week Welding Stamping Assembly Shipping I I I I 500 pcs 1,200 pcs 800 pcs 1,500 pcs Takt = Takt = Takt = Inventory C.T. = C.T. = C.T. = Part A = 750 pcs D.T. = D.T. = 20% D.T. = Part B = 600 pcs FTQ = FTQ = FTQ = 90% Part C = 1650 pcs C/O Time = 4 hrs. C/O Time = C/O Time = # of shifts = Lot Size = Lot Size = Lot Size = # of Shifts # of Shifts # of Shifts WIP = 25 pcs. WIP = 60 pcs. WIP = 550 pcs.
PC & L 6 week rolling forecast Weekly Order 6 week rolling forecast Customer Weekly Order Daily Ship Schedule Supplier Demand/month: 2 x/ week 2 x/ day .17 days .27 days .5 days .4 days TPc/t = 2.5 days .008 days .02 days .18 days 1.0 days Part A = 705 pcs. Weekly Build Schedule Part B = 600 pcs. Part C = 1650 pcs. Step 7: Calculate Total Product Cycle Time # of shifts = Stamping Welding Assembly Shipping I I I I 800 pcs 500 pcs 1,200 pcs 1,500 pcs Takt = Takt = Takt = Inventory C.T. = C.T. = Part A = 750 pcs C.T. = D.T. = D.T. = 20% Part B = 600 pcs D.T. = FTQ = 90% Part C = 1650 pcs FTQ = FTQ = C/O Time = 4 hrs. C/O Time = C/O Time = # of shifts = Lot Size = Lot Size = Lot Size = # of Shifts # of Shifts # of Shifts WIP = 25 pcs. WIP = 60 pcs. WIP = 550 pcs. Changeover Downtime FTQ
Press Room Fork Truck Die Bench Die Room Die Room Receiving Shipping (Remove from Schedule I I Board) Dies Dies 12 shifts 2 shifts Schedule Board (Forecast) Current State Map Step 8: Detail Off-Line Activities • Show on the map using general icons • Detail on another sheet using either reference VSM and/or process flow-charting
Current State Map Additional Mapping Icons Kanban Path Kanban Post Supermarket Kanban arriving in batches Signal Kanban MAX 50 PCS First-In First-Out Flow FIFO Withdrawal Kanban PhysicalPull Process Kaizen Production Kanban Leveling
Data Collection • It is not necessary that attribute data be precise. • It is necessary that the information at least be directionally correct. • Knowing that uptime is 82.7% vs. 82% is normally not necessary. • An assumption of 80%, however, when reality is 65% can be detrimental in that it may substantially misdirect the future state development and the prioritization of improvement activities. 8 1
Agenda - Session 1 • Introduction to Value Stream Mapping • Current State Map • Data Collection • Activity: Map Current State
Shipping/Receiving schedules • Pack sizes at eachprocess • Demand rates by process (Takt Time) • Working hours and breaks • Scrap • Inventory Points (location & size) • Rework • How Operations are scheduled • Downtime Data Collection Attribute Data to Collect • Work-in-process inventory • Overtime per week • Process cycle times • Number of product variations at each step • Batch (lot) sizes • Changeover times • Changeover frequencies
Data Collection Data Box Tailor the data box for your plant’s needs. Data Box The data box should be open ended to allow for additional attributes.
Scrap Manufacturing Process Kaizen Lightning Burst Outside Source/ Customer Buffer or Safety Stock Manual Information Flow Data Box Electronic Information Flow I Inventory Production Kanban Truck Shipment o o o Withdrawal Kanban Finished Goods to Customer Signal Kanban Push Arrow Kanban Post Supermarket Introduction to Value Stream Mapping Tools
Your Operating Time per Shift TAKT = Customer Requirement per Shift 27,000 sec = 59 sec 59 sec. 460 pieces 59 sec. 59 sec. Data Collection What is Takt Time? Takt Time is the rate at which production should run to meet customer demand The idea is to synchronize the pace of production to the pace of sales. 8 1
Scheduled Runtime Takt Time = Total Customer Requirements Data Collection How to Calculate Takt Time? • 1. Determine Total Customer Requirements for the affected process. • 2.Determine the Scheduled Runtime (S.R.) for the affected process: Scheduled Runtime = (Effective Minutes) - (Planned Downtime) Effective Minutes = (minutes per shift) - (approved breaks) Planned Downtime is the amount of time an operation is down for scheduled reasons. 3.Calculate Takt Time: 8 3
Data Collection Identify Opportunities for Improvement ?
Agenda - Session 1 • Introduction to Value Stream Mapping • Current State Map • Data Collection • Activity: Map Current State
Complete draft of current state value stream map. • Review draft and identify open issues. • Resolve open issues. Complete current state value stream map. • Session 2Review current state value stream map. Activity: Map the Current State Approximate Total Time: Complete By Task
Session 2Agenda • Review current state • Over view of developing future state • Develop future state • Develop action plans to get to future state • Assign owners, timing, and frequency of review for action items • Report to leadership • Support • Learning
Agenda - Session 2 • Review Current State Map • Design Future State - Purpose • Future State Map • Consider Key Questions • Summary • Activity: Design Future State
Agenda - Session 2 Review Current State Map • Design Future State - Purpose • Future State Map • Consider Key Questions • Summary • Activity: Design Future State
Design Future State - Purpose Purpose • Define how the plant will operate in the future • Serve as the blueprint for implementation Without it, the Current State Map is nothing more than wallpaper ! 8 1
Future State Map The Steps Step 1: Step 2: Step 3: Step 4: Step 5: Step 6: Step 7: Validate Customer Demand Draw the Future State Process Flow Map the Future State Material Flow Map the Future State Information Flow Calculate Total Product Cycle Time Detail Off-Line Activities Outline a Plan 8 2
MSS 2 Inj: MSS I Molding Change I Over 2 2 Level Sender 2 Inj: Sender ABABA. . . Ass’y Ass’y Molding I 2 Staging Labels I Fuel Pump No Flow I by Truck Ass’y Attendance 10 4 Ass’y Tank 4 10 Tank Stamping Ass’y card Plants Ass’y I Stamping Ass’y Plants by card 7 No Flow (Pitch = 14 Units) Change 12 Over Uptime Zone Maintenance & Fast Response Perform to TAKT & Pitch. Cycle-Time Driven. Batches. Produce to Order Load Leveling and Pull METRICS Item Current Target Total product cycle time Parts / Person Hour Delivery Performance Inventory (days) Overtime Uptime Future State Map Step7: Outline a Plan Future Condition Original Condition 1999 2000 Activity 1ST 2ND 3RD 4TH 1ST 2ND 3RD 4TH Establish TAKT & Flow in Tank Ass'y Stamping Changeover Reduction Reduce Stamping Buffer Move Ass'y to Plant 10 Establish TAKT & Flow in Sender Ass'y Pull To Sender Ass'y Training
Future State Map The Steps “Do It” Implement - Implement - Implement Action - Action - Action - Action - Action “Check It - Follow up”
A simple way to approach the Future State Map is to begin by modifying the Current State Map. Future State Map The Steps
Agenda - Session 2 • Review Current State Map • Design Future State - Purpose • Future State Map • Consider Key Questions • Summary • Activity: Design Future State
Consider Key Questions What is Takt Time? Will you build to a finished goods supermarket or directly to shipping? Where can you use continuous flow processing? Where will you need to use supermarket pull systems to control production of upstream processes? At what single point in the production chain will you schedule production? (Typically, this will be the final process.) How will you level the production mix at the pacemaker process? What increment of work will you consistently release and take away at the pacemaker process? What process improvements will be necessary at the value stream to flow as your future state design specifies?
The Wallof Protection: Our Manufacturing Plant The Customer Finished Goods Supermarket Consider Key Questions Will you build to a finished goods supermarket or directly to shipping? Every effort should be madeto minimize these variations. These variations are drivenby one of the seven formsof waste and should be eliminated. • Protects your customer from significant process variation. • Protects your manufacturing operation from significant demand variation. Eliminate Waste 8 4
I I Consider Key Questions Where can you use continuous flow processing? (Batch Process vs. Continuous Flow) Batch Process Process“A” Process“B” Process“C” Elapsed Time:60 Minutes Continuous Flow (One-Piece Flow) Process“A” Process“B” Process“C” Elapsed Time:01 Minute 8 3
Process“A” Process“B” Process“C” I I Consider Key Questions Where can you use continuous flow processing? (Batch Process vs. Continuous Flow) Batch Process Process“A” Process“B” Process“C” Elapsed Time:60 Minutes Continuous Flow (One-Piece Flow) Elapsed Time:01 Minute
Consider Key Questions Where can you use continuous flow processing? • This question is asking where you will require supermarkets or where you will have coupled processes. • Evaluate the following factors when considering this question: • Cycle Time Compatibility • Equipment Uptime/Downtime (remember that coupling can multiply the effects of downtime) • Equipment Investment • Flexibility 8 2
FIFO Consider Key Questions Where will you need to use supermarket pull systems to control production of upstream processes? • Typically, a pull system is needed wherever continuous flow stops. • The only exception would be to use a simple FIFO system. • FIFO may work in situations where only inventory quantity needs to be controlled (not sequencing, batch sizing, etc.). • Visual quantity control is needed - without physically counting parts and scheduling machine operation. 8 2
PC&L oxox Molding Assembly FIFO Pacemaker Process Consider Key Questions At what single point in the production chain will you schedule production? • Usually, you will schedule production at the final process. • Exceptions to this might be where your final process is supplied through FIFO. 8 1
Without Leveling With Leveling Work- Work- load load Time Time Consider Key Questions How will you level the production mix at the pacemaker process? • Consideration must be given to level both the mix and overall quantity of product scheduled for production. • Leveling of the production schedule is a fundamental requirement for the efficient management of operations 8 2
Level Scheduling Traditional Scheduling Daily Production Part A 218 Part B 655 Part C 874 Part D 2622 Daily Production Mon 4370 Part D Tue 4370 Part D Wed 4370 Part D Thu 4370 Part C Fri 3277 B 1092 A Part A Part B Part D Part C Part D Part A Part B Part C PartD Part D Part A Part B Part C Part D Part A Part D Part B Part C Part D Part A Part B Part C Part C Part D Part A & B Mon. Wed. Tue. Thu . Fri. Mon. Wed. Tue. Thu . Fri. Consider Key Questions How will you level the production mix at the pacemaker process? (Continued) Leveling of the overall production quantity must be supported by the leveling of the product mix. 8 2
Consider Key Questions How will you level the production mix at the pacemaker process? (Continued) • Leveling of the product mix must be supported by small lot production. • Small lot production must be supported by quick set-up.