Download
1 / 20
200 likes | 371 Views
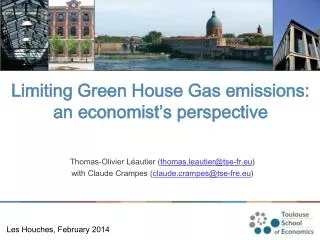
Better Green House Gas Calculations for Buildings. Michael Deru ASHRAE Albuquerque, NM June 30, 2010. NREL is a national laboratory of the U.S. Department of Energy, Office of Energy Efficiency and Renewable Energy, operated by the Alliance for Sustainable Energy, LLC. Why?.

E N D
Better Green House Gas Calculations for Buildings Michael Deru ASHRAE Albuquerque, NM June 30, 2010 NREL is a national laboratory of the U.S. Department of Energy, Office of Energy Efficiency and Renewable Energy, operated by the Alliance for Sustainable Energy, LLC.
Why? Equals emissions from India 17.6% 36.8% 19.2% 35.6% 27.6% Source: Energy Information Administration, Emissions of Greenhouse Gases in the United States 2008
Calculating GHGs is Easy, right? Step 1: Find a GHG calculator Step 2: Plug in your energy use Step 3: Done, next project But, Which GHG calculator should I use? Where do the numbers come from and what do they mean? A survey by Texas A&M found 48 GHG calculators and large differences between them
GHG Calculator Comparisons Credit: Michael Deru, NREL
Potential Issues in Building GHG Calculations • Finding and interpreting emission factors • Regional variations in electric grid • Transmission and distribution losses • Time of day variations • Life-cycle emissions • On-site fuel combustion • On-site renewable energy • Accounting for electricity exports • Accounting for energy and CO2offsets
Where do GHG Emissions Come From? Scope-1 Emissions Scope-2 Emissions Combustion CO2, CH4, N20 Precombustion CH4, CO2, N2O Combustion CO2, CH4, N2O Leakage CFC, HFC, SF6 Leakage SF6 Scope-3 Emissions Typically only combustion emissions are accounted for Credit: Michael Deru, NREL
Global Warming Potential • GWP compares the ability to trap radiant energy in the atmosphere relative to CO2 over a defined period. Sources: IPCC 2007 and ASHRAE 2006 Handbook
Global Warming Potential • GWP compares the ability to trap radiant energy in the atmosphere relative to CO2 over a defined period. Sources: IPCC 2007 and ASHRAE 2006 Handbook
National Electric Grid Source: NERC - www.nerc.com/page.php?cid=1|9|119
National Electric Grid Balancing Authorities Source: NERC - www.nerc.com/page.php?cid=1|9|119
eGRIDSubregions (26) So, what’s the best region to use? National, NERC, eGRID, State? Source: EPA - www.epa.gov/cleanenergy/energy-resources/egrid/index.html
Regional Variability in Emission Factors Source: eGRID 2007v1.1, EPA
Transmission and Distribution Losses Transmission Not well understood Highly variable with load eGRID estimate ~ 5.3% Worst case estimate from an isolated plant ~ 40% loss Distribution
Emission Factors CO2e emissions for delivered electricity (lb/kWh) • CO2e emissions for natural gas • 0.5 lb/kWh • Precombustion emissions ~ 18% of total Source: Deru and Torcellini (2007) Source Energy and Emission Factors for Energy Use in Buildings
Average Hourly Emissions CAISO Emissions peak at night! AZNMNV Credit: Michael Deru, Daniel Studer, Greg Brinkman - NREL
Marginal Hourly Emissions – CAISO lb/MWh Credit: Michael Deru, Daniel Studer, Greg Brinkman - NREL
Recommendations • Clearly define the project scope • Use eGRIDsubregion or larger region data • Include T&D losses • Include precombustion emissions • Don’t forget on-site combustion and refrigerant leakage (if applicable) • Use time-of-day factors to evaluate load shifting and renewable energy
Conclusions • Can’t get exact GHG emissions • Hopefully, we can get close and understand whether they are going up or down • Nation wide hourly and time of use emissions and source energy data coming in the fall