Download
1 / 21
210 likes | 317 Views
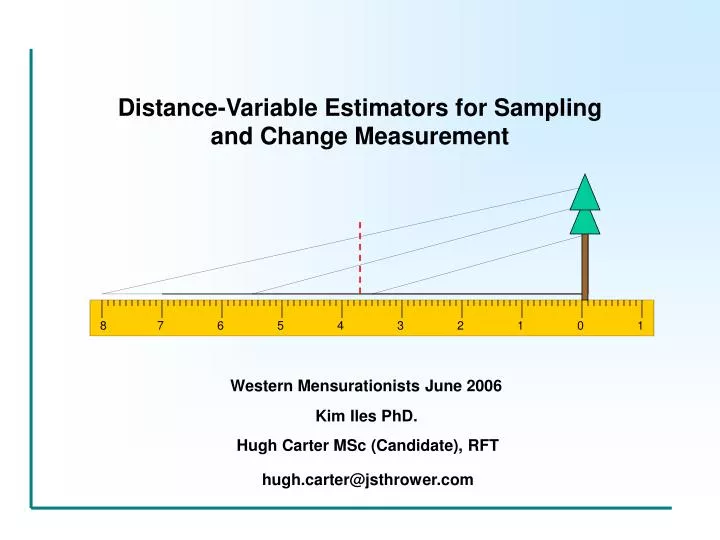
Distance-Variable Estimators for Sampling and Change Measurement. 8. 7. 6. 5. 4. 3. 2. 1. 0. 1. Western Mensurationists June 2006. Kim Iles PhD. Hugh Carter MSc (Candidate), RFT. hugh.carter@jsthrower.com. 8. 0. 7. 1. 6. 2. 5. 3. 4. 4. 3. 5. 2. 6. 7. 1. 8. 0. 9. 1.

E N D
Distance-Variable Estimators for Sampling and Change Measurement 8 7 6 5 4 3 2 1 0 1 Western Mensurationists June 2006 Kim Iles PhD. Hugh Carter MSc (Candidate), RFT hugh.carter@jsthrower.com
8 0 7 1 6 2 5 3 4 4 3 5 2 6 7 1 8 0 9 1 Outline • Background • Bias (or lack of) • Shapes • Change over time • Compatibility • Simple example • Edge • Future Work • Summary
8 0 7 1 2 6 5 3 4 4 5 3 6 2 1 7 0 8 1 9 Background • A reminder of why we might want to use Variable Radius Plots • (VRP) for measuring change: • - Efficiency (cost and time). • - Remeasurement of existing plots. • - Increase precision? • Need a solution for applying VRP for measuring change over time. • Problems encountered include: • - High variability due to on-growth. • - Extending concepts to variables other than volume and BA. • - Providing a solution that is easily applied and understood.
8 0 7 1 2 6 5 3 4 4 5 3 6 2 1 7 0 8 1 9 Background Continued • Attempts have been made to solve these problems, however none • have covered them all. • Distance-Variable estimators reduce variability, extend to any • variable for any object of interest, and provide an easy to apply • method. • Distance-Variable estimators are an extension of the “Iles method” • to any variable of interest on any sampled object of interest.
8 0 7 1 6 2 5 3 4 4 3 5 2 6 1 7 0 8 1 9 Bias Horvitz-Thompson Estimator Potential random sample points Object of interest Inclusion circle
8 0 7 1 6 2 3 5 4 4 3 5 6 2 7 1 0 8 1 9 Expectation of Bias Continued Distance-Variable Estimator Potential random sample points Object of interest Inclusion circle
8 0 7 1 6 2 5 3 4 4 5 3 6 2 1 7 0 8 1 9 Shapes Why Use a Cone? 3x Value • Easy to use and visualize • - height at point is 3x value • - height at base is 0x value • Average at all potential sample • points will give estimate • Can get a simple “Value Gradient” 0x Value
8 0 7 1 2 6 3 5 4 4 5 3 2 6 7 1 0 8 1 9 Shapes Continued How do they work? 111 m2/s2/kg • Units no longer an issue • Average at sample points give estimate • Sample point is ¼ of distance from edge • Estimate = ¼ * 111m2/s2/kg = 27.37m2/s2/kg 0 m2/s2/kg Average of all sample points is 37 m2/s2/kg
0 8 1 7 2 6 5 3 4 4 5 3 6 2 7 1 0 8 1 9 Change Over Time Traditional Subtraction Method
0 8 1 7 2 6 5 3 4 4 5 3 6 2 7 1 0 8 1 9 Change Over Time Distance-Variable Method
0 8 1 7 2 6 3 5 4 4 5 3 6 2 7 1 8 0 1 9 Compatibility Both methods are compatible, however the traditional subtraction method is more variable!
8 0 1 7 2 6 5 3 4 4 3 5 6 2 1 7 8 0 1 9 Basal Area Example Traditional Method (BAF 10m2/ha) 40 35 Total 30 25 Total BA/ha 20 15 10 5 0 On-growth 0 1 2 3 4 Measurement Distance-Variable Method (BAF 10m2/ha) Survivor Total Mortality On-Growth On-growth
0 8 1 7 6 2 5 3 4 4 5 3 6 2 1 7 8 0 1 9 Basal Area Example Traditional Method (BAF 10m2/ha) Total Total Survivor Distance-Variable Method (BAF 10m2/ha) Survivor Total Mortality On-Growth Survivor
0 8 1 7 6 2 5 3 4 4 5 3 6 2 1 7 8 0 1 9 Basal Area Example Traditional Method (BAF 10m2/ha) Total Total Mortality Distance-Variable Method (BAF 10m2/ha) Survivor Total Mortality On-Growth Mortality
0 8 1 7 2 6 5 3 4 4 5 3 2 6 7 1 8 0 9 1 Basal Area Example Traditional Method (BAF 10m2/ha) Total Total Total Mortality Tree Survivor Tree On-Growth Tree Survivor On-growth Mortality Distance-Variable Method (BAF 10m2/ha) Survivor Tree Total Mortality Tree On-Growth Tree Survivor On-growth Mortality
8 0 7 1 6 2 5 3 4 4 5 3 6 2 1 7 0 8 1 9 Edge • Existing techniques for correcting edge remain applicable. - Walk-through - Toss-back - Mirage • Unbiased if inclusion areas are symmetrical through the tree. • If extra sample points are needed the DV estimator is used • instead of the traditional estimator.
8 0 7 1 6 2 5 3 4 4 3 5 2 6 1 7 0 8 1 9 Future Work • Variance control through different shaped estimators. • Non-stationary object sampling. • Density surface mapping. • Efficiency/Precision gains?
8 0 7 1 2 6 5 3 4 4 3 5 6 2 1 7 8 0 1 9 Summary Distance-Variable Method • EXTENDS TO ANY VARIABLE FOR ANY OBJECT!! • Unbiased • Easy to apply and understand • Smoothes change/growth curves • Compatible • Works with existing edge techniques
0 8 1 7 2 6 5 3 4 4 5 3 6 2 7 1 0 8 1 9 Acknowledgements Kim Iles & Associates
0 8 7 1 6 2 3 5 4 4 5 3 6 2 7 1 0 8 1 9 Volume Example Traditional Method Distance-Variable Method
8 0 7 1 6 2 5 3 4 4 3 5 2 6 7 1 8 0 9 1 Summary • Background • Bias (or lack of) • Shapes • Change over time • Compatibility • Simple example • Edge • Future Work • Summary