Download
1 / 23
260 likes | 910 Views
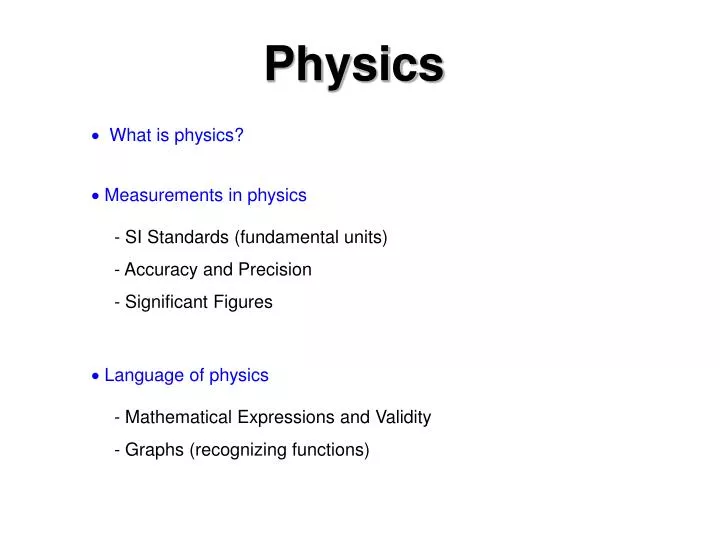
Physics. What is physics?. Measurements in physics. - SI Standards (fundamental units) - Accuracy and Precision - Significant Figures . Language of physics. - Mathematical Expressions and Validity - Graphs (recognizing functions) . What is physics?.

E N D
Physics What is physics? • Measurements in physics - SI Standards (fundamental units) - Accuracy and Precision - Significant Figures • Language of physics - Mathematical Expressions and Validity - Graphs (recognizing functions)
What is physics? • A way of describing the physical world 6th Century B.C. in the Greek city of Miletus (now in Turkey) a group of men called “physikoi” tried to answer questions about the natural world. Physics comes from the Greek “physis” meaning “nature” and the Latin “physica” meaning natural things • Physics is understanding the behavior and structure of matter - It deals with how and why matter and energy act as they do - Energy is the conceptual system for explaining how the universe works and accounting for changes in matter - The word energy comes from the Greek “en”, meaning “in” and “ergon”, meaning “work”. Energy is thus the power to do work. Sounds weird!! - Although energy is not a “thing” three ideas about energy are important It is changed from one form to another (transformed) by physical events It cannot be created nor destroyed (conservation) 3. When it is transformed some of it usually goes into heat
Areas within physics studied this year: Mechanics – Motion and its causes Thermodynamics – Heat and temperature Vibrations and Waves – Periodic motion Optics – Behavior of light Electromagnetism – Electricity, magnetism and EM waves Atomic – Structure of the atom, energy associated with atomic changes Nuclear – Structure of the nucleus, energy associated with nuclear changes
What is physics? - Investigations in physics generally follow the scientific method Observations + initial data collection leading to a question, hypothesis formulation and testing, interpret results + revise hypothesis if necessary, state conclusions - Physics uses models to simplify a physical phenomenon They explain the most fundamental features of a phenomenon. Focus is usually on a single object and the things that immediately affect it. This is called the system • Models help: identify relevant variables and a hypothesis worth testing guide experimental design (controlled experiment) make predictions for new situations
Measurements in physics - SI Standards (fundamental units) Fundamental units: distance – meter (m) time – second (s) mass - kilogram (kg) temperature - kelvin (K) current – ampere (A) luminous Intensity - candela (cd) Amount of substance – mole (mol) – 6.02 x 10²³ Derived units:combinations of fundamental units speed (v) = distance/time acceleration (a) = velocity / time force (F) = mass x acceleration energy (E) = force x distance charge (Q) = current x time units: m/s units: m/s/s= m/s2 units: kgm/s2 = N (Newton) units: kgm2/s2 = Nm = J (Joule) units: As = C (Coulomb)
Measurements in physics - Precision and Accuracy “It’s better to be roughly right than precisely wrong” – Allan Greenspan, U.S. Federal Reserve Chairman (retired)
Measurements in physics - Precision The precision of a series of measurements is an indication of the agreement among repetitive measurements. A “high precision” measurement expresses high confidence that the measurement lies within a narrow range of values. Precision depends on the instrument used to make the measurement. The precision of a measurement is one half the smallest division of the instrument. The precision of a measurement is effected by random errors that are not constant but cause data to be scattered around a mean value. We say that they occur as statistical deviations from a normalized value. Random variations can be caused by slight changes in pressure, room temperature, supply voltage, friction or pulling force over a distance. Human interpretation is also a source of random error such as how the instrument scale is read between divisions.
Measurements in physics - Significant Figures Significant figures reflect precision. Two students may have calculated the free-fall acceleration due to gravity as 9.625 ms-2 and 9.8 ms-2 respectively. The former is more precise – there are more significant figures – but the latter value is more accurate; it is closer to the correct answer. General Rules: 1. The leftmost non-zero digit is the most significant figure. 2. If there is no decimal point, the rightmost non-zero digit is the least significant. 3. If there is a decimal point, the rightmost digit is the least significant digit, even if it is a zero. All digits between the most significant digit and the least significant digit are significant figures.
Measurements in physics - Arithmetic with Significant Figures When adding or subtracting measured quantities the recorded answer cannot be more precise than the least precise measurement. Add: 24.686 m + 2.343 m + 3.21 m Answer: 30.24 m 3.21m has the least dp’s When multiplying or dividing measurements the factor with the least number of significant figures determines the recorded answer Answer: 6.8 cm2 2.1 cm has only 2sf Multiply: 3.22 cm x 2.1 cm Note significant digits are only considered when calculating with measurements; there is no uncertainty associated with counting. If you counted the time for ten back and forth swings of a pendulum and you wanted to find the time for one swing, the measured time has the uncertainty but the number of swings does not.
Measurements in physics - Repeated Measurements Random errors influence the precision of measurements taken during an experiment. Repeated measurements help reduce the effects of random uncertainties. When a series of measurements is taken for a measurement, then the arithmetic mean of a reading is taken as the most probable answer. This is the same as saying, “take the average”. For example suppose we have the following repeated measurements l1 = 140 cm , l2 = 136 cm , l3 = 142 cm, l4 = 144 cm lmean = l1 + l2 + l3 + l4 = 140cm + 136cm + 142cm +144cm = 140.5 cm n 4 The measurement is therefore: l = 141 cm (3sf)
Measurements in physics - Accuracy and systematic uncertainty The accuracy of a measurement is its relation to the true, nominal, or accepted value. It is sometimes expressed as a percentage deviation from the known value. The known or true value is often based upon reproducible measurements. Instruments might not be accurate. A two-point calibration can be used to check. Does the instrument read zero when it should and does it give a correct value when it is measuring an accepted value Systematic uncertainty effects the accuracy of a measurement because it comes from a source of error that is constant throughout a set of measurements. The measurements are consistently shifted in one direction. A common source of systematic error is not zeroing your measuring instrument correctly so that all data is constantly shifted away from the true value. This can give high precision but poor accuracy.
Measurements in physics - Accuracy and systematic uncertainty - Percentage Deviation The accuracy of a measurement is sometimes expressed as a percentage deviation from the known value. The known or true value is often based upon reproducible measurements. For example, if a student determines experimentally the acceleration due to gravity is 9.5 m/s2 but the known value is taken as 9.8 m/s2 then …..
Measurements in physics - Mistakes Mistakes on the part of the individual such as.. • Misreading scales (using equipment incorrectly) • Poor arithmetic and computational skills • Wrongly transferring raw data to the final report • Using the wrong theory and equations These are a source of error but ARE NOT considered a source of experimental error
Language of physics - Mathematical Expressions and Validity Physicists use the tools of mathematics to describe measured or predicted relationships between physical quantities in a situation. A physical equation is a compact statement based on a model of the situation Like most models, physics equations are only valid if they can be used to make predictions about situations. Physical expressions can be checked for validity a number of ways; • 1. through an experiment • through dimensional analysis • by order of magnitude estimation Lets say that you are trying to find the mass of an object using, M = V / Dimensionally: m3 / kg/m3 = m3 m3 / kg = m6 / kg not kg So the variables are in the incorrect order! (M = V )
Language of physics - Tables (recording data) Data should be organized and legible • Give your table a specific title • Record constants above the table • Use Column headings and include units • Record data to the appropriate number of significant figures. Identifying, specific title Multiple tables must be numbered Table 1. Length vs. Period For a Pendulum Mass of the pendulum bob is 103 g The angle of swing is 4 degrees Constants are listed above the table Units given per measured quantity Answer limited to 2 SF plus reaction time of stop watch is about 0.2 s which limits answer to 1 dp
Language of physics - Graphs (recognizing functions) So you’ve found a question that needs to be answered, identified variables, restricted them, produced a mathematical model and devised an experiment that will collect data. How do you know that your data supports or refutes your model? The answer lies in graphs – It is important to be able to recognize the shape of a graph and be able to relate that shape to a mathematical function. You can then compare this function to your model. Some functions found in physics are shown on the next two slides! Direct yx y = kx k = slope of the line y is directly proportional to x Note: If the line does not go through (o,o) it is linear y = kx + b b = y intercept Independent y = k y does not depend on x b
Language of physics - Graphs (recognizing functions) Inverse Proportional y 1/x y = k/x y = k x-1 y is inversely proportional to x Square yx2 y = kx2 y is proportional to the square of x Square root y √x y = k √ x Y = k x1/2 Y is proportional to the square root of x Note: all these functions are all power functions as they fit the general expression, y = A xBwhere A and B are constants
Language of physics - Graphs (recognizing functions) Exponential Growth y = anbx y increases exponentially with x Exponential Decay y = an−bx Y decreases exponentially with x Periodic y = A sin (Bx + C) Y varies periodically with x
Language of physics - Graphs (recognizing functions) Let’s say that you are investigating how the period (T) of a pendulum (time for one swing) depends on the length (l) of the pendulum and you have come up with a mathematical model that says, T = 2 ( l/ g). You then test this model experimentally and plot a graph of T vs. l (shown below). Which function best describes your data? The curve through the data can’t be a straight line because as the length decreases, the period decreases so at zero length we would expect the pendulum to take no time to swing back and forth. The model says that T l or T l1/2 This suggests that we should look at a power function and in particular a square root function (y=kx1/2) You can see that the computer generated power function fit is a good fit to our model as the data fits T = (2.06) l0.46 The power 0.46 is very close to 0.5 (1/2) We can also use our data to verify the constant g because Comparing our model with the fit equation we find 2 / g = 2.06 so g = (2 / 2.06)2 = 9.3
Language of physics - Graphs (turning a curve into a straight line) Sometimes its nicer to see a relationship from a straight line graph rather than a curved graph, especially when we use uncertainty bars (next slide). To turn a curve into a straight line you look at the proportional statement. If you wanted to turn the pendulum curved graph into a straight line graph what would you plot on each axis? Now T l so our data should fit a straight line if we plot T vs. l instead of T vs. l You can see that the data now fits a nice straight line which goes very close to the origin. The slope (1.84) can be related back to the proportionality constant which is 2 / g