Download
1 / 15
150 likes | 482 Views
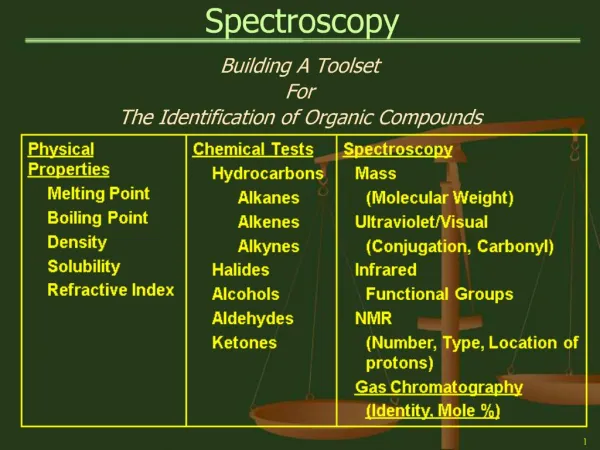
SPECTROSCOPY 101 . Arkansas 2-Day October 2013 Lisa McGaw OSU lmcgaw@me.com. Spectroscopy . Spectroscopy –(In plain English) - a technique used to help us understand the molecular structure of matter by observing motion in response to the absorption of energy. TYPES OF SPECTROSCOPY . IR

E N D
SPECTROSCOPY 101 Arkansas 2-Day October 2013 Lisa McGaw OSU lmcgaw@me.com
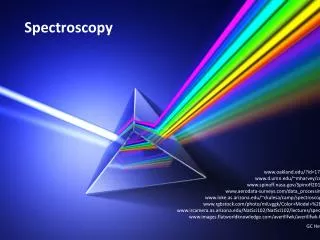
Spectroscopy • Spectroscopy –(In plain English) - a technique used to help us understand the molecular structure of matter by observing motion in response to the absorption of energy
TYPES OF SPECTROSCOPY • IR • UV-VIS • MASS SPEC • PES • Many others – microwave, esr; x-ray; NMR; Raman; atomic absorption, etc.
IR Spectroscopy • 1.D (LO 1.15) • Transitions in molecular motion – rotational, vibrational and electronic (low energy to high energy) • https://en.wikipedia.org/wiki/Infrared_spectroscopy • Detect presence of different types of bonds • Useful for identification and structural analysis of organic and inorganic compounds.
UV- Vis Spectroscopy • 1.D (LO 1.15 and LO 1.16) (SP 4.1, 4.2, 5.1 and 6.2) • Transitions in electronic energy levels • Used to probe electronic structure • Molecules absorb UV or Visible light • A = abc (absorption directly related to concentration)
How Do the Colors Relate? • UV region – not visible to our eyes • Visible region – ROYGBIV • Low energy higher energy
Mass Spectroscopy • 1.D (LO 1.14) (SP 1.4 and SP 1.5) • Demonstrates direct evidence of different isotopes from the same element • Average atomic mass estimated from mass spec data • Solid, liquid or gas sample is ionized; • Ions are separated according to mass to charge ratio
PES Spectroscopy • 1.B (LO 1.7* also LO 1.5, 1.6, 1.8) (SP 1.5, 5.1, 6.2) • Photoelectric effect – incident light ejects electrons • Energies provide evidence for shell model • Intensity of signal implies number of electrons at that energy level