Download
1 / 20
200 likes | 205 Views
This chapter explores the distribution of the world's population, focusing on the major population clusters in East Asia, South Asia, Southeast Asia, and Western Europe, as well as the factors that contribute to their concentration. The chapter also discusses sparsely populated regions and the expansion of the ecumene over time.

E N D
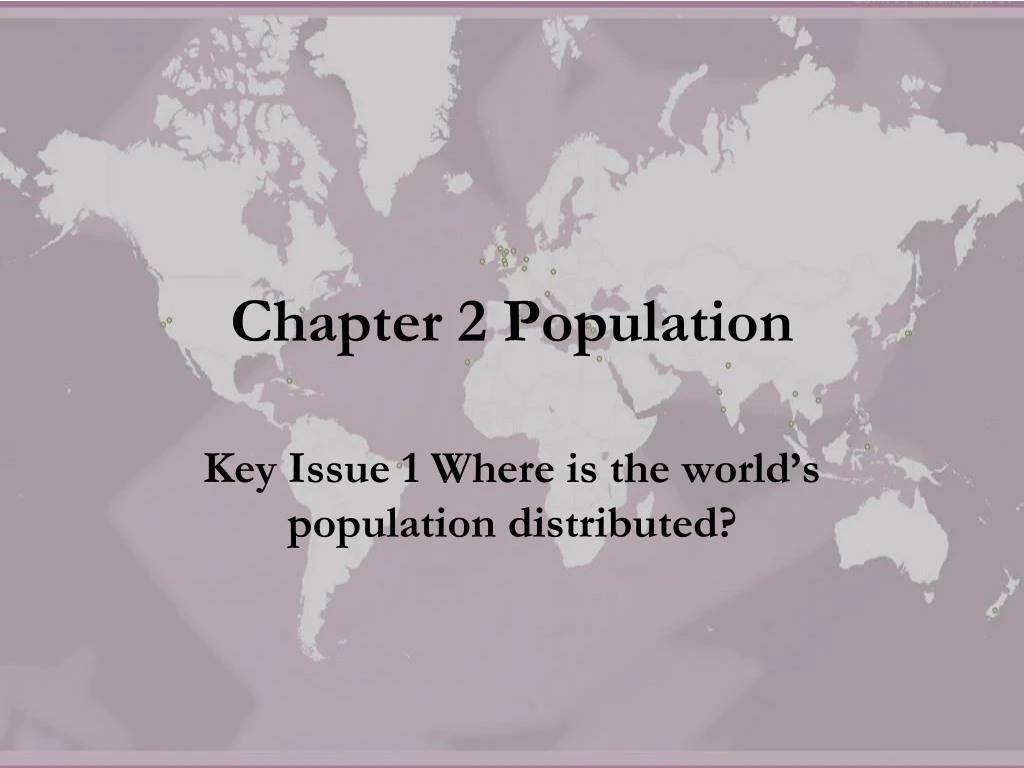
Chapter 2 Population Key Issue 1 Where is the world’s population distributed?
Population Concentration • Approximately 2/3 of the world’s population is clustered into four regions: East Asia, South Asia, Southeast Asia, and Western Europe. • What do they have in common? • Ocean or River Source • Low-lying Areas • Fertile Soil • Temperate Climate • All based on physical geography.
World Population Cartogram Fig. 2-1: This cartogram displays countries by the size of their population rather than their land area.(Only countries with 50 million or more people are named.)
East Asia • 1/4 of the world’s people live in East Asia, the largest cluster of inhabitants. • 5/6 of the people in this concentration live in the People’s Republic of China, the world’s most populous country. • Chinese population is clustered near the Pacific Coast and in several fertile river valleys. • 1/2 of the people live in rural areas where they work as farmers. • In Japan and South Korea, population is not distributed uniformly either. • More than 3/4 of the Japanese and Koreans live in urban areas.
South Asia • Second largest concentration of people, more than 1/4, is in South Asia. • India, the world’s second most populous country, contains more than ¾ of the South Asia population concentration. • Much of this area’s population is concentrated along the plains of the Indus and Ganges rivers. • Population is also concentrated near India’s two long coastlines. • Like the Chinese, most people in South Asia are farmers.
Southeast Asia • The world’s fourth-largest population cluster, after Europe, is in Southeast Asia, mostly on a series of islands. • Indonesia, which consists of 13,677 islands, is the world’s fourth most populous country. • Several Philippine islands contain high population concentrations. • The Indochina population is clustered along several river valleys and deltas at the southeastern tip of the Asian mainland. • A high percentage of people in Southeast Asia work as farmers. • The three Asian population concentrations together comprise over half of the world’s total population, but together they live on less that 10% of Earth’s land area. • The same held true 2,000 years ago.
Europe • Combining the populations of Western Europe, Eastern Europe, and the European portion of Russia forms the world’s third-largest population cluster, 1/9 of the world’s people. • 3/4 of Europe’s inhabitants live in cities. • They import food and other resources. • The search for additional resources was a major incentive for Europeans to colonize other parts of the world during the previous six centuries.
Other Population Clusters • The largest population concentration in the Western Hemisphere is in the northeastern United States and southeastern Canada. • About 2% of the world’s people live in the area. • Less than 5% are farmers. • Another 2% of the world’s population is clustered in West Africa, especially along the south – facing the Atlantic coast. • Approximately half in Nigeria, and the other half is divided among several small countries west of Nigeria. • Most people work in agriculture.
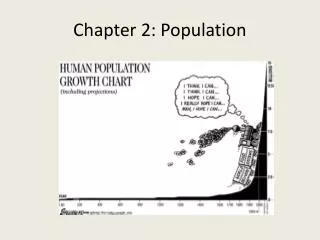
Sparsely Populated Regions • Few people live in regions that are too dry, too wet, too cold, or too mountainous for… agriculture. • ¾ of the world’s population lives on only 5% of Earth’s surface. • The portion of the Earth’s surface occupied by permanent human settlement is called ecumene. • The areas of Earth that humans consider too harsh for occupancy have diminished over time, while the ecumene has increased. • Even 500 years ago much of NA and Asia lay outside the ecumene.
Expansion of the Ecumene5000 BC - AD 1900 Fig. 2-3: The ecumene, or the portion of the earth with permanent human settlement, has expanded to cover most of the world’s land area.
Dry Lands • Areas too dry for farming cover approximately 20% of Earth’s land surface. • Deserts generally lack sufficient water to grow crops. • May contain natural resources… notably, much of the world’s oil reserves.
Wet Lands • Lands that receive very high levels of precipitation may also be inhospitable for human occupation. • These lands are located primarily near the equator. • Combination of rain and heat rapidly depletes nutrients from the soil, thus hindering agriculture. • In seasonally wet lands, such as those in Southeast Asia, enough food can be grown to support a large population.
Cold Lands and High Lands • Much of the land near the North and South poles is covered with ice or the ground is permanently frozen (permafrost). • Relatively few people live at high elevations. • Exceptions: Latin America and Africa.
Density • The # of people occupying an area of land • It can be computed in several ways • Arithmetic Density • Physiological Density • Agricultural Density
Arithmetic Density • Aka population density • It’s the total # of people divided by the toal land area • This information is easy to obtain • It answers the “where” question—who is trying to live where? • But other density measures are better at explaining “why”
Arithmetic Population Density Fig. 2-4: Arithmetic population density is the number of people per total land area. The highest densities are found in parts of Asia and Europe.
Physiological density • It’s the total # of people supported by a unit area of arable land • Arable land is land that is suited for agriculture • It’s a better measure for population AND availability of resources • Comparing arithmetic and physiological density helps us understand the capacity of the land to yield enough food for the needs of the people
Physiological Density Fig. 2-5: Physiological density is the number of people per arable land area. This is a good measure of the relation between population and agricultural resources in a society.
Agricultural Density • It’s the ratio of the # of farmers to the amount of arable land • It helps account for economic differences • MDCs have lower ag. Density b/c technology and finance allow few people to farm and still feed many people • Compare physiological density and agriculture to understand relationships b/w population and resources in a country