Download
1 / 12
130 likes | 149 Views
Map elements. Mrs Diana Makarenko-Piirsalu MSc in Landscape Ecology and Environmental Protection Geolytics OÜ Mere tee 15, Saviranna , Jõelähtme vald , Harjumaa , ESTONIA diana.makarenko-piirsalu @g eolytics.ee Mob. +372 556 19 636.

E N D
Map elements Mrs Diana Makarenko-Piirsalu MSc in Landscape Ecology and Environmental Protection Geolytics OÜ Mere tee 15, Saviranna, Jõelähtmevald, Harjumaa, ESTONIA diana.makarenko-piirsalu@geolytics.ee Mob. +372 556 19 636 ESTP Course: Use of GIS in NSIs – Representing statistics on thematic maps, Kongsvinger,Norway, 5th to 7th of March, 2013 Attribution (by) Licensees may copy, distribute, display and perform the work and make derivative works based on it only if they give the author or licensor the credits in the manner specified by these. http://creativecommons.org/licenses/by/3.0/
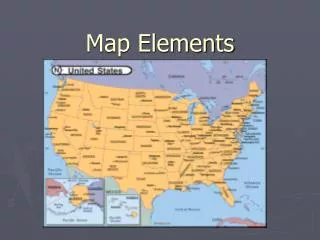
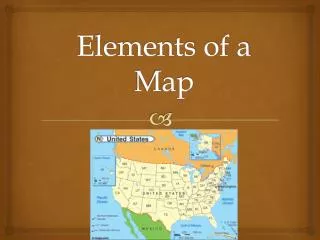
Edge of paper Frame line Titel Subtitel Neat line Inset Scale Orientation Legend Data source
Map elements • The most maps are created from the common set of elements: • Frame and neat line • Mapped area • Inset map • Title and subtitle • Legend • Data source • Scale • Orientation Take the most of the available space Take the least of available the space Source: Solcum et al, „Thematic cartography and Geovisualization 2007
Frame and neat line • Help organise the map content and define its extent • Frame line is used in most cases • Neatline is used mainly when mapped area needs to be cropped Title Title Subtitle Subtitle
Mapped area • Is the area on the earth which will be represented on the map • Mapped area is represented as large as possible • Not too close to the frame or neat line and leaving room for other elements • Should be visually centred Title Title Title Title Legend Legend Legend Legend
Inset • Can serve different purposes: • To enlarge important areas • To show related topics to the main theme • To show areas which can not be showed on the main scale • Locator inset shows primary mapped area in relation to larger and more easily recognisable area Source: Canadian national mapping agency http://atlas.nrcan.gc.ca/site/english/dataservices/wallmaps.html Source: UK Ordinar Survey, http://www.globalmapping.uk.com/earth5.asp
Title and subtitle • Describe map theme as short as possible • Will draw attention • No abbreviations • Word “map“ should be avoided • Title is visually bigger than subtitle • Avoid bold, italics. Keep it simple • Located most often above the map or above the legend Source: US Census atlas, 2000
Legend • Defines all thematic symbols • Self-explanatory symbols are excluded (for example country borders) • Avoid using box around the legend • Forms a part of the map and normally is not separated • Symbols should be identical (size, color, orientation to the map) • Has sometimes also a title to explain indicators used • Symbols and explanations should be aligned Source: US Census atlas, 2000
Data source • Allows to determine the orgin of data • Data source is the smallest type of texts used in maps • Commonly located on the right or left of the map bottom within the frame line • Coordinate system and projection can be mentioned in case helping reading the map Source: EFGS
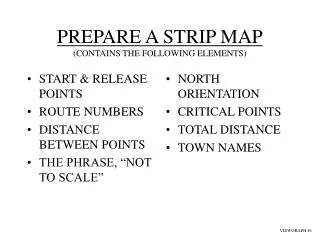
Scale • Helps to understand how much reduction has taken place • Helps to measure the distances • Ways of representing scale: • Representative fraction is ratio of map distance to Earth distance . Becomes invalid then the map is enlarged or reduced. • Verbal scale explains the relation between the map and earth distances. Becomes invalid then the map is enlarged or reduced. • Scale bar represents the map distance to Earth distance by using graphic. 1:100 000 1 cm to 100 km
Orientation • Represents the north on the map • Should be represented then north is not on the top • Ways of representing scale: • North arrow - myriads of choices but keep it simple • Graticules – grid lines representing longitude and latitude. Meridians are indicating the north direction
THANK YOU! Mrs Diana Makarenko-Piirsalu MSc in Landscape Ecology and Environmental Protection Geolytics OÜ Mere tee 15, Saviranna, Jõelähtmevald, Harjumaa, ESTONIA diana.makarenko-piirsalu@geolytics.ee Mob. +372 556 19 636 ESTP Course: Use of GIS in NSIs – Representing statistics on thematic maps, Kongsvinger,Norway, 5th to 7th of March, 2013