Download
1 / 59
590 likes | 597 Views
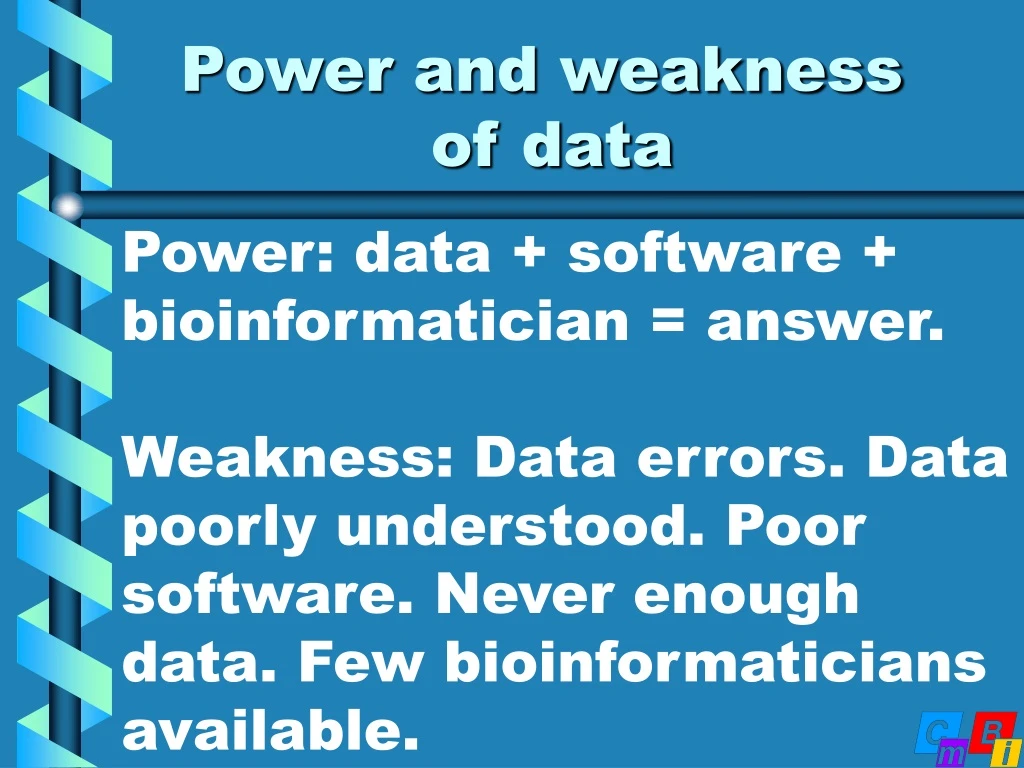
Power and weakness of data. Power: data + software + bioinformatician = answer. Weakness: Data errors. Data poorly understood. Poor software. Never enough data. Few bioinformaticians available. Laerte about structures:. sequence , Gert. “Use the Force, Luke”. Signals in Sequences.

E N D
Power and weakness of data Power: data + software + bioinformatician = answer. Weakness: Data errors. Data poorly understood. Poor software. Never enough data. Few bioinformaticians available.
Laerte about structures: sequence , Gert “Use the Force, Luke”
Signals in Sequences The number of sequences available for analysis rapidly approaches infinite. We need new ways to look at all this information.
The First Law: First law of sequence analysis: A conserved residue is important.
With thousands of aligned sequences: Second law of sequence analysis: A very conserved residue is very important.
Signals in sequences:Conserved, CMA, variable QWERTYASDFGRGH QWERTYASDTHRPM QWERTNMKDFGRKC QWERTNMKDTHRVW Black = conserved White = variable Green = correlated mutations(CMA)
Sequence Signals • Three types of information • from multiple sequence • alignments: • Conservation • Correlation • Variability
Artefacts Wrong sequence signals can result from: Not enough sequences Too conserved sequences Too variable sequences Over-alignment Over-interpretation
Sequence Entropy 20 Ei = S pi ln(pi) i=1
Sequence Variability Sequence variability is the number of residue types that is present in more than 0.5% of the sequences.
Entropy - Variability Evolution = try everything (and keep what works well) Variability = Chaos (try everything) Entropy = Information (keep what works well)
Entropy - Variability Variability is result of DNA trying everything. Entropy is the protein’s break on evolutionary speed.
Ras Entropy - Variability 11 Red 12 Orange 22 Yellow 23 Green 33 Blue
Ras Location 11 Red 12 Orange 22 Yellow 23 Green 33 Blue
Protease Entropy - Variability 11 Red 12 Orange 22 Yellow 23 Green 33 Blue
Protease Location 11 Red 12 Orange 22 Yellow 23 Green 33 Blue
Globin Entropy - Variability 11 Red 12 Orange 22 Yellow 23 Green 33 Blue GPCR
Globin Location 11 Red 12 Orange 22 Yellow 23 Green 33 Blue
And now for drug design: GPCR 11 Red 12 Orange 22 Yellow 23 Green 33 Blue
GPCRs: (Membrane facing amino acids left out) 11 Red 12 Orange 22 Yellow 23 Green 33 Blue
Summary Given many sequences: Every residue’s role known. Signaling paths detectable. Two step evolutionary model: First main site, soon after modulator site.
Beyond the summary Sequence -> structure -> function is wrong. It should be: Structure -> sequence -> function. And, because active sites are at the surface, conserved residues are at or near the surface.
Beyond the summary Why do all TIM-barrel enzymes have the functional residues at the C-terminal side of the strands?
Beyond the summary 23 Green: Modulator Up to 18 residue types 22 Yellow: Core Up to 14 residue types 12 Orange: Around main site Up to 8 residue types 33 23 22 12 11 Red: main site Up to 4 residue types 11
The weakness of data Data errors. Poor software. Data poorly understood. Never enough data. Few bioinformaticians around.
The weakness of data WHAT_CHECK Rob Hooft www.cmbi.kun.nl/gv/servers/ www.cmbi.kun.nl/gv/pdbreport/
Structure validation Everything that can go wrong, will go wrong, especially with things as complicated as protein structures.
Why ? Why does a sane (?) human being spend fourteen years to search for twelve million errors in the PDB?
Because: All we know about proteins is derived from PDB files. If a template is wrong the model will be wrong. Errors become smaller when you know about them.
What do we check? Administrative errors. Crystal-specific errors. NMR-specific errors. Really wrong things. Improbable things. Things worth looking at. Ad hoc things.
Error detection Detecting errors is one thing fixing them another… We try not to say about the structure that it is wrong, but we try to say what is wrong about the structure. Give hints how to fix things.
Our errors Four sigma: 12.000 false positives. Administrative errors misunderstood. Improbable is not wrong. Poor data makes errors unavoidable. Bugs.