Download
1 / 8
80 likes | 191 Views
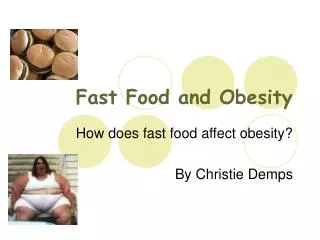
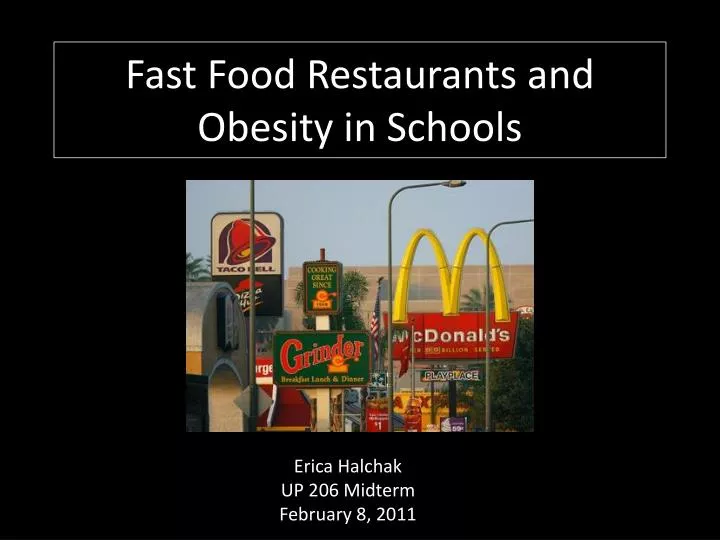
Fast Food Restaurants and Obesity in Schools. Erica Halchak UP 206 Midterm February 8, 2011. The prevalence of obesity in Los Angeles schoolchildren is steadily on the rise.

E N D
Fast Food Restaurants and Obesity in Schools Erica Halchak UP 206 Midterm February 8, 2011
The prevalence of obesity in Los Angeles schoolchildren is steadily on the rise. In Los Angeles County, 47.7% of children eat fast food at least once a week and 43.3% of children drink at least one soda or sweetened drink a day. Only 27.4% of teens (age 14-17) consume five or more servings of fruits and vegetables a day. Data from Los Angeles County Department of Public Health Photo from: http://www.stepsweightloss.com/wp-content/uploads/2010/03/obese-child.jpg
Los Angeles County Obesity Rates In Los Angeles County, 22.9 % of children in grades 5, 7, and 9 are obese (BMI greater than the 95th percentile) (LA DPH, 2007). Certain “hot spots” occur in the county, including South and East LA. Created by Erica Halchak
El Monte Obesity Rates in Schools 28% of children in El Monte are obese. Obesity rates in children are measured using Body Mass Index (BMI). For children ranging from ages 10-16 the “over the healthy” zone qualifies as gender specific BMI-for-age > 95th percentile. Created by Erica Halchak
El Monte Schools Proximity to Fast Food Fast food restaurants close to school environments provide unhealthy but convenient choices for students. Many restaurants are located within 0.5 miles from a school. In El Monte, 12 out of 33 schools have a fast food establishment within 0.5 miles of the campus. Created by Erica Halchak
El Monte Schools Obesity Rates and Fast Food Proximity Of the 12 El Monte Schools that had a fast food establishment within 0.5 miles, 10 had high obesity (83.3%) . Of the 21 El Monte Schools without a fast food establishment within 0.5 miles, 16 had high obesity (76.2%). Created by Erica Halchak High obesity is defined as more than 23% of students with BMI > 95th percentile. Low obesity is defined as less than 23% of students with BMI > 95th percentile. 23% was chosen because that is the average in Los Angeles County.
Results: Does not appear to be a large difference between high obesity levels and having a fast food restaurant within 0.5 miles from school. Future research: Would like to use this metric for other cities around Los Angeles County to see if fast food restaurants tend to be located within 0.5 miles of a school. Would like to look at the how socioeconomic status is related to obesity and fast food restaurant locations. Would like to examine mode of transportation to and from school. Sources: California Department of Education, UCLA Map Share, SimplyMap, Los Angeles Department of Public Health, El Monte Unified School District, Mountain View Unified School District.
Requirements used • Inset map. • Point or line graduated symbol. • Graduated symbol depicting obesity rates in school children in El Monte • Aggregating attribute fields. • Schools that had fast food restaurants within a half mile were selected and a new file was created. They were then coded as either over 23% of students were obese or less than 23% of students were obese. Then the schools that did not have a fast food restaurant within a half mile were also coded as either greater than or less than 23% of students obese. • Boundary sub-sets selections • El Monte file was created from Los Angeles Communities file. • Buffering. • Half mile buffer added to depict how close fast food restaurants were to school. • Geocoding. • Addresses for fast food restaurants and schools were geocoded then mapped.