Download
1 / 13
130 likes | 270 Views
NPV and IRR. An Impromptu Discussion of Net Present Value and Internal Rate of Return. Since we have a bit of extra time on our hands, I thought I would treat you to what you will have in store if you take finance at the university level. Recall: Present Value & Valuation.

E N D
NPV and IRR An Impromptu Discussion of Net Present Value and Internal Rate of Return Since we have a bit of extra time on our hands, I thought I would treat you to what you will have in store if you take finance at the university level.
Recall: Present Value & Valuation • Present Value and Valuation • Recall: A fundamental assertion of finance holds that the value of a stock is based on the present value of its future cash flows • Examples: Dividends, stock prices, interest payments, principal repayments • But present value is not limited to stocks and bonds • We can calculate the present value of a future stream of income from any source • Real estate, factories, bridges, water projects, nuclear reactors, etc. You already know how to compute the present value of any stream of income.
Calculating Present Value • Do your remember the formula for calculating Present Value? (The one we never used?) • Using the Present Value tables, we used: Value = Dividend1*PVM1 + Dividend2*PVM2 + Dividend3*PVM3 + etc In this version, the cash flows were dividends and the price of the stock when we forecast we were ready to sell, but they could be any cash flow – rent, bridge tolls, electricity generation, etc.
Example: Pretzels Unlimited • Recall Example 1: • Assume it is January 1, 2012. Pretzels Unlimited is currently selling for $22 per share and will pay $2.00 per share in dividends in 2012. PU expects to increase their dividends to $2.20 in 2013, $2.30 in 2014 and $2.30 in 2015. We will be selling the stock at the end of 2015 and we expect the price to be $27 per share at that time. Our required rate of return is 12%. • Value of stock = present value of future dividends + present value of price of stock when you plan to sell Value = ($2.00*0.893)+(2.20*0.797)+(2.30*0.712)+(2.30*0.636) + ($27.00*0.636) = = [ $1.786 + $1.7534 + $1.6376 + $1.4628 ] + $17.172 = = $6.6398 + $17.172 = $23.8118 $23.81 If our required rate of return is 12%, this is a pretty good stock to buy.
Example: Pretzels Unlimited (continued) • Recall Example 1: • Pretzels Unlimited in Spreadsheet Format Since $23.81 is greater than the current market price of $22, then we would consider this a good investment for our Required Rate of Return of 12%.
How Was Present Value Useful? • The Present Value told us what we thought the future stream of income was worth today • And if it were roughly equal to or greater than the current market price • (What we had to pay today for that future stream of income) • Then we predicted that it was a good investment • For our desired Required Rate of Return Recall that the Required Rate of Return was very important because as you changed the Required Rate of Return, the Present Value changed, sometimes greatly!
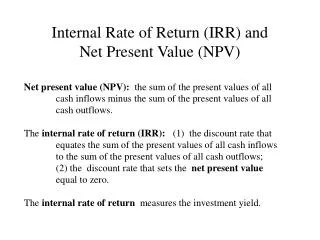
Present Value versus Net Present Value • Okay, so what is Net Present Value (NPV)? • Net Present Value takes into account all cash flows (called inflows) and all cash outflows • And if Net Present Value is positive, then it is a good investment • For our Required Rate of Return • And if Net Present Value is negative, then it is not a good investment • For our desired Required Rate of Return Net Present Value is much more popular when you get to upper division and graduate level finance classes at the university.
Calculating Net Present Value (continued) • Example 1: The Net Present Value is positive because the Present Value was greater than the market price (Initial Cash Outflow).
Calculating Present Value & NPV • Are you sick and tired of calculating Present Value using the Present Value tables? • Good! That means you know how to calculate and understand what it means to discount a stream of future cash flows. And I have done my job! • Hey! It is easier than using the formula with the exponents, right? • But you also know how to use the easy way! • Spreadsheets calculate Present Value and Net Present Value without breaking a sweat! • Let’s take a look Someday, I want to add a lab component to this class or create a one-unit class that is done completely in the computer lab.
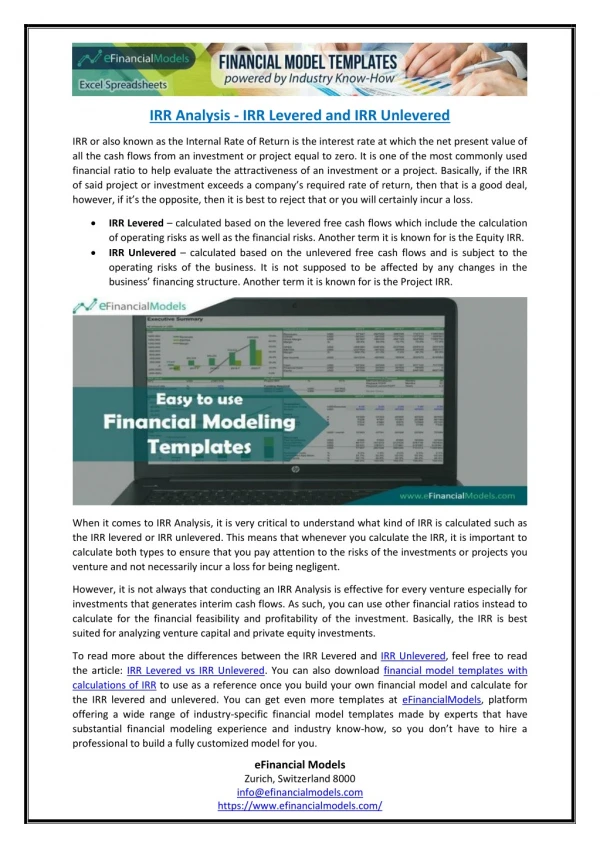
Internal Rate of Return (IRR) • This brings us back to Internal Rate of Return • The very popular measure that business people and investors use when measuring the rate of return from a stream of future income • You will also learn how to compute the Internal Rate of Return manually if you go on to an upper division or graduate level finance class at the university • Specifically, the Internal Rate of Return is the desired Required Rate of Return where the Net Present Value equals zero • “Huh? What?” It is easier to show you how to calculate IRR than it is to explain it to you. Let’s go back to the spreadsheet.
Calculating IRR w/o a Spreadsheet • T’ain’t easy! • In fact, it is a real PITA • I have not done it manually since I left graduate school • Uh, that is why they made computers … • Plus, as we saw on the spreadsheet, Internal Rate of Return can give you some very bizarre and unreliable results • Sometimes there can be more than one Internal Rate of Return (!?) With odd or unusual streams of cash outflows and inflows, you really should create a Net Present Value graph like the one we saw in the spreadsheet to check if your Internal Rate of Return is reasonable.
So What’s the Bottom Line? • So how does having a spreadsheet change the way we do our calculations? • The quick answer is, “Not much! But … • It makes calculating Present Value or Net Present Value (whichever you prefer) much, much easier” • But the tables are not that hard, are they? • And it gives you an extremely precise result when calculating your rate of return from a stream of future income • Which is exactly what I do not want you to rely on! “Uh, why not?” Because unless you are calculating the return from a very predictable source (example: bonds), precision is your enemy! Never forget that you are predicting the future, and as Mark Twain said, “Prediction is difficult, especially about the future!”
NPV and IRR Thank you for your time.