Download
1 / 31
330 likes | 500 Views
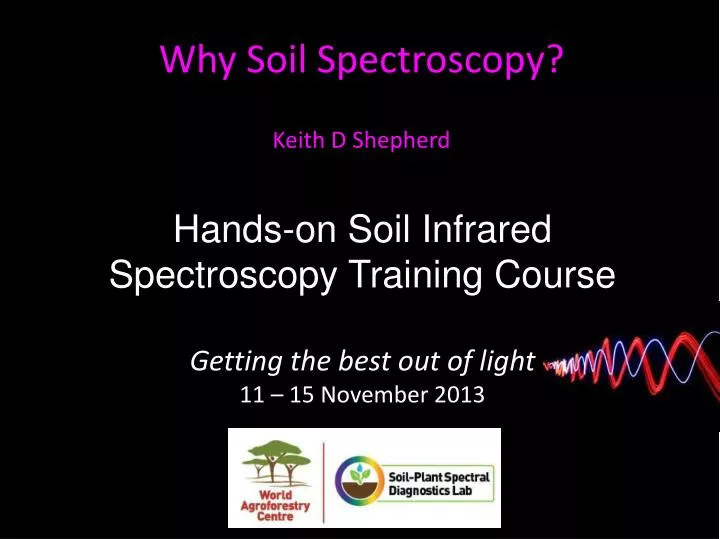
Why Soil Spectroscopy? Keith D Shepherd. Hands-on Soil Infrared Spectroscopy Training Course Getting the best out of light 11 – 15 November 2013. Surveillance Science.

E N D
Why Soil Spectroscopy? Keith D Shepherd Hands-on Soil Infrared Spectroscopy Training CourseGetting the best out of light11 – 15 November 2013
Surveillance Science UNEP. 2012. Land Health Surveillance: An Evidence-Based Approach to Land Ecosystem Management. Illustrated with a Case Study in the West Africa Sahel. United Nations Environment Programme, Nairobi. http://www.unep.org/dewa/Portals/67/pdf/LHS_Report_lowres.pdf • Measure frequency of problems and associated risk factors in populations using statistical sampling designs & standardized measurement protocols Shepherd KD and Walsh MG (2007) Infrared spectroscopy—enabling an evidence-based diagnostic surveillance approach to agricultural and environmental management in developing countries. Journal of Near Infrared Spectroscopy 15: 1-19.
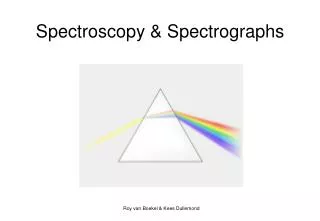
Simplicity of light Wavelength unit converter.xls
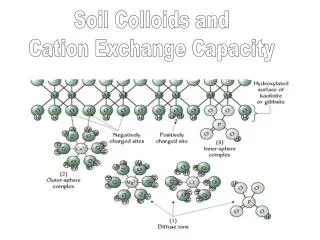
Spectral shape relates to basic soil properties • Mineral composition • Iron oxides • Organic matter • Water (hydration, hygroscopic, free) • Carbonates • Soluble salts • Particle size distribution Functional properties
Soil function largely determined by soil mineralogy and soil organic matter • Soil mineralogy • nutrient quantity (stock) and intensity (strength of retention by soil) • pH and buffering, variable charge • anion and cation exchange capacity • carbon saturation; protection • aggregate stability, dispersion/flocculation • resistance to erosion • Soil organic matter • soil structure • aggregate stability, resistance to erosion; water holding capacity • carbon storage and turnover • cation exchange capacity • nitrogen, organic P, sulphur supply
Origin of infrared spectral absorption features Water vibrations movie Carbon dioxide-vibrations movie SpectraSchool - Royal Society of Chemistry http://www.rsc.org/
Soil IR fundamentals 1 = Fingerprint region e.g Si-O-Si stretching/bending 2 = Double-bond region (e.g. C=O, C=C, C=N) 3 = Triple bond (e.g. C≡C, C≡N) 4 = X–H stretching (e.g. O–H stretching) NIR = Overtones; key features clay lattice and water OH; SOM affects overall shape
Field spectroscopy Shepherd KD and Walsh MG. (2002) Development of reflectance spectral libraries for characterization of soil properties. Soil Science Society of America Journal 66:988-998.
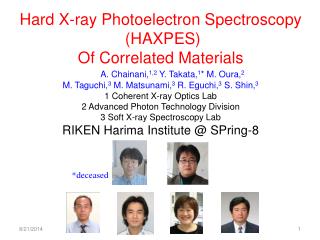
Infrared spectroscopy Dispersive VNIR FT-NIR FT-MIR Robotic FT-MIR Portable Brown D, Shepherd KD, Walsh MG (2006). Global soil characterization using a VNIR diffuse reflectance library and boosted regression trees. Geoderma 132:273–290. Shepherd KD and Walsh MG (2007) Infrared spectroscopy—enabling an evidence-based diagnostic surveillance approach to agricultural and environmental management in developing countries. Journal of Near Infrared Spectroscopy 15: 1-19. Terhoeven-Urselmans T, Vagen T-G, Spaargaren O, Shepherd KD. 2010. Prediction of soil fertility properties from a globally distributed soil mid-infrared spectral library. Soil Sci. Soc. Am. J. 74:1792–1799 Handheld MIR ? Mobile phone cameras ?
Instrument protocols Dispersive spectrometer Fourier Transform Spectrometer
Data & soil library management Soil archiving system 1.2 km shelving to hold over 40 t of soil Barcoding
Calibration Soil organic carbon • Spectralpretreatments • Derivatives, smoothing • Data miningalgorithms: • PLS + • SupportVectorMachines • Neural networks • MultivariateAdaptiveRegressionSplines • BoostedRegressionTrees • RandomForests • BayesianAdditiveRegressionTrees Training Out-of-bag validation Soil pH R package soil.spec Soil spectral file conversion, data exploration and regression functions
Inter-instrument calibration transfer Robotoic high throughput MIR
Submit batch of spectra online • Uncertainties estimated for each sample • Samples with large error submitted for reference analysis • Calibration models improve as more samples submitted • All subscribers benefit
Soil-Plant Spectral Diagnostics Lab • 500 visitors/yr again • 338 instruction • 13 PhD, 4 MSc training
Spectral Lab Network • Planned • Eggerton University, Kenya • MoA, Liberia • IER, Arusha, Tanzania • FMARD, Nigeria • NIFOR, Nigeria • CNLS, Nairobi • BLGG, Kenya (mobile labs) • IAMM, Mozambique • AfSIS, Sotuba, Mali • AfSIS, Salien, Tanzania • AfSIS, Chitedze, Malawi • CNLS, Nairobi, Kenya • ICRAF, Nairobi, Kenya • CNRA, Abidjan, Cote D’Ivoire • KARI, Nairobi, Kenya • ICRAF, Yaounde, Cameroon • ObafemiAwolowo University, Ibadan, Nigeria • IAR, Zaria, Nigeria • ATA, Addis Ababa, Ethiopia (+ 5 on order) • IITA, Ibadan, Nigeria • IITA, Yaounde, Cameroon • ICRAF, Nairobi, Kenya
Spectral fingerprinting X-ray diffraction spectroscopy Total X-ray fluorescence spectroscopy Infrared spectroscopy
Land Health Surveillance Sentinel sites Randomized sampling schemes Consistent field protocol Coupling with remote sensing Soil spectroscopy Prevalence, Risk factors, Digital mapping
AfSIS • 60 primary sentinel sites • 9,600 sampling plots • 19,200 “standard” soil samples • ~ 38,000 soil spectra • 3,000 infiltration tests • ~ 1,000 Landsat scenes • ~ 16 TB of remote sensing data to date
Main AfSIS workflow, products & services overview Markus Walsh, August 2013
Africa Soil Information Service www.africasoils.net Ethiopia: current spatial coverage of new ground observations and measurements Markus Walsh, August 2013
Africa Soil Information Service www.africasoils.net Probability topsoil pH < 5.5 ... very acid soils prob(pH < 5.5) Markus Walsh
Africa Soil Information Service www.africasoils.net [P] ppm “Best” current topsoil macro-nutrient (N,P,K,S,Ca & Mg) concentration predictions [N] ppm [K] ppm [S] ppm [Ca] ppm [Mg] ppm Markus Walsh
Living Standards Measurement StudyIntegrated Surveys on AgricultureLSMS-IMS Improve measurements of agricultural productivity through methodological validation and research Responding to policy needs to provide data to understand the determinants of social sector outcomes. Soil fertility monitoring component Two pilot countries
MTT-Finland FoodAfricaSoil Micronutrients Evidence-based micronutrient management Healthy crops Healthy livestock Healthy soils Healthy people
Land HealthSurveillance Out-scaling Global-Continental Monitoring Systems Vital signs CRP pan-tropical sites AfSIS Regional Information Systems National surveillance systems Tibetan Plateau/ Mekong Evergreen Ag / Horn of Africa Ethiosis Project baselines SLM Cameroon Parklands Malawi Rangelands E/W Africa Cocoa - CDI MICCA EAfrica
Future directions • Centralized calibration service on-line • Direct calibration of MIR to plant/soil response data • Rural MIR labs providing low cost soil testing for smallholder farmers • Complementarity of IR, TXRF, XRD, Handheld XRF • Decision cases