Download
1 / 29
300 likes | 489 Views
Congenital malformations and birth weight: a family perspective. Dr. Kari K.Melve Department of Public Health & Primary Health Care University of Bergen, Norway October, 2002. Why is it fascinating to study families?.

E N D
Congenital malformations and birth weight: a family perspective Dr. Kari K.Melve Department of Public Health & Primary Health Care University of Bergen, Norway October, 2002
Why is it fascinating to study families? Families constitute small ”populations” with shared genetic and environmental features Dependencies between family members have implications for risk assessment (for instance of adverse pregnancy outcome)
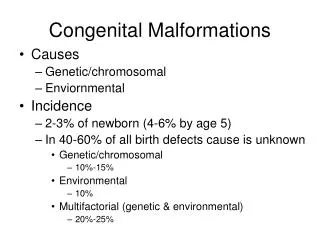
Why is it fascinating to study birth defects? • Birth defects account for a large proportion of perinatal and infant mortality • The etiology of birth defects is in large not known • 25 - 30 % of major birth defects may be attributed genetic factors
Background for this study: • There is a large and significant correlation between siblings’ birth weights • Low birth weight tends to recur in sibships
In general, infants with congenital malformations have lower mean birth weight than infants without malformations
Growth restriction may be primary, predisposing the fetus for malformations • … or secondary to the malformations • ...or coexist with the malformations, and have common underlying causes
Objective: • To study birth weight of malformed infants’ siblings • ..and compare with birth weight of infants in families without any registered malformations
Materials and methods: • Data were from the Medical Birth Registry of Norway from 1967 to 1998 • Infants were linked to their mothers through the unique personal identification number
Study population: • 551,478 mothers with at least two infants and • 209,423 mothers with at least three infants • These family sets were not mutually exclusive
Familes were grouped according to whether and in which birth order an infant was registered with a birth defect • Families where none of the infants had a birth defect were used as control families
Classification of birth defects: • Categories of defects were defined on the basis of ICD-8, providing 24 groups of isolated defects • Multiple defects were combined in a separate category
Analyses: • We compared mean birth weight (BW) and gestational age (GA) between infants of same birth order in families with and without birth defects
For the main analyses all birth defects were pooled into one group • In addition: the most frequent organ-specific malformations were analyzed separately
Statistics: • T-tests • Analyses of variance • Gestational age • Mother’s age (years) • Mother’s education • Marital status • Maternal diabetes • Interpregnancy interval • Time period
Results: • Malformed infants had lower mean birth weights than control infants of same birth order • Non-malformed siblings’ mean birth weights did not differ significantly from control infants of same birth order (Table I)
Gestational age analyses:Malformed infantshad shorter mean GA than control infants • Non-malformed siblingshad mean GA close to that of control infants
Adjustment for GA reduced the BW difference between malformed infants and control infants, • but had only little impact on the BW differences between non-malformed siblings and corresponding control infants
Adjusting for maternal age, maternal educational level, marital status, maternal diabetes, time period of first birth and inter-pregnancy interval did not change the BW differences notably (multiple analyses of variance)
Organ-specific defects: • Sub-group analyses: For most organ-specific defects the non-malformed siblings’ mean BW did not differ significantly from that of corresponding control infants
Exceptions: • Siblings of infants with multiple malformations, and second-born siblings where the first-born infant was registered with a cleft liphad significantly lower mean BW than control infants of same birth order
Discussion: • BW is strongly correlated within sibships, and growth restriction tends to recur in sibships
In contrast: Reduced BW associated with congenital malformations is restricted to the pregnancy with the malformed fetus
This argues against a theory of growth restriction as a primary etiological factor for the development of malformations
Persisting biological, environmental or socioeconomic factors may play different roles for the growth restriction associated with congenital anomalies and for growth restriction not associated with such
Exceptions: • Studies have found associations between smokingin pregnancy and risk of cleft lip in the offspring • An increased risk of multiple malformations in the offspring with decreasing socioeconomic status of the family has been reported
Conclusions: • We conclude that reduced birth weight associated with congenital anomalies is specific to the affected pregnancy