Download

1 / 33
350 likes | 582 Views
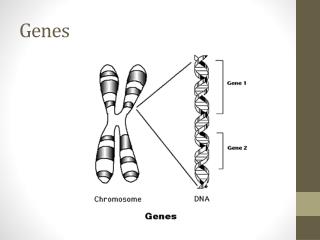
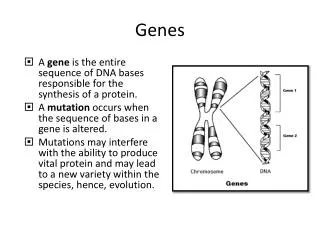
Genes. Eukaryotic Protein-Coding Gene Structure. coding. non-coding. Regulatory Region. Size: 50 > 10,000 bp Contains multiple small DNA sequence elements (5 – 20 bp) > bind regulatory proteins Regulatory elements can be negative or positive acting

E N D
Eukaryotic Protein-Coding Gene Structure coding non-coding
Regulatory Region • Size: 50 > 10,000 bp • Contains multiple small DNA sequence elements (5 – 20 bp) > bind regulatory proteins • Regulatory elements can be negative or positive acting • Regulatory regions found in 5’ flanking region, introns, and 3’ flanking regions – most common in 5’ flanking regions and large introns
non-coding 5’-Untranslated Region • Contained in mRNA • Spans from start of transcription to start of translation • Multiple functions – translational efficiency • Size varies greatly - average > 300 nt (human) coding
non-coding Coding Sequence • Begins with initiator methionine (AUG codon) • Sometimes multiple initiator methionines are used • Stops with termination codon (UAA, UAG, and UGA) • Sizes varies: average = 1340 nt (human); encodes ~450 aa protein coding
non-coding 3’ Untranslated Region • Spans translational termination codon > end of mRNA • Multiple functions: mRNA stability and localization • AAUAAA sequence signals where poly(A) is to be added (10-35 nt upstream from cleavage/poly(A) site) • Size varies: average - 700 nt (human) coding
Poly(A) • Added posttranscriptionally (not encoded in gene) • Size varies (10-200 nt) depending on organism • Functions: mRNA stability and translational efficiency • Size of tract shortens with time • All mammalian mRNAs have poly(A) except histone mRNAs Poly(A)
Exons • Genes have a modular design • Evolutionarily assembled in pieces • Functional unit > exons • # exons can vary from 1 > 178 • Average # exons/gene – different organisms • Yeast ~1 • Drosophila 4 • Human 9 • Human genes (mean sizes) • Exon size 145 bp coding non-coding
Introns • Introns vary greatly in size • Most ~ 50 bp but can be > 15 kb • Large genes – large introns • Small genes – small introns • Size differs between species • C. elegans 267 bp • Drosophila 487 bp • Human 3,365 bp • Human introns > exons in size Intron 1 Intron 2
Genetics • Mutants • Wild-type – “normal” fully-active gene • Null – absence of any activity (e.g. deletion) • Hypomorph – reduced function • Hypermorph – enhanced activity • Neomorph – expressed in cells normally not expressed (transgenic approach) • Phenotypic analysis – development, morphology, behavior, fertility, etc. • Gene regulation • Examine how mutation in Gene A influences expression of other genes
Genetic and Molecular Genic Relationships • OrganismGenesLethal loci (%total genes) • Yeast 5,800 1,800 (30%) • Nematode 18,400 3,500 (20%) • Drosophila 13,600 3,600 (25%) • Mouse – similar % based on gene knockout studies • Lethal loci – loss of function mutant that results in death • Result: Only ~20-30% genes can be mutated to lethality
Genetic and Molecular Genic Relationships • Why are there genes with no apparent function? • Gene may not be doing anything • Other genes may compensate for defect (redundancy) • Double mutant analysis often provides evidence for this explanation • Common for highly-related genes to be (at least partially) redundant • Defect may be too subtle to detect • Proper assay not used • Need proper ecological setting and evolutionarily-relevant time span to detect • May be conditional
CNS Midline Cell Development and Transcription Requires Single-minded Function Wild-type sim Cell division Cell morphology Gene expression
Ubiquitously-Expressed Sim Transforms Entire CNS into CNS Midline Cells Heat shock-sim Rhomboid-lacZ Uninduced Induced a-LacZ
Gene Regulation • Regulatory proteins > DNA cis-control elements • Positive and negative regulation • Combinatorial regulation > highly specific patterns of spatial, temporal and quantitative expression Murine transthyretin gene
Sim:Tgo Binding Sites (CNS Midline Elements - CMEs) are Required for Midline Transcription 0.95 kb Toll-lacZ a-LacZ 1 2 3 4 X X X X CME > ACGTG
Array Analysis of Gene Expression: Drosophila • Understand complete array of gene regulatory events that underlie: • Development • Tissue and cell identity • Aging • Behavior • Circadian rhythms • Learning and memory
Example: Single-minded (Sim): Master Regulator of CNS Midline Cell Development and Transcription Sim protein (green) > CNS midline cells Vnd protein (red) > lateral CNS
Array Analysis of Gene Expression • Midline gene expression program > identify all genes expressed in midline cells • Study: function and regulation • Approaches: • Purify midline cells (GFP) > compare to other cell types and developmental time intervals • Mutant (sim) vs. wild-type • Misexpression of sim vs. wild-type • Transgenes – express in entire CNS • Genetics – snail mutant > express in entire mesoderm
Midline and Lateral CNS GFP Lines sim-GFP vnd-GFP Dissociate embryonic cells > FACS Compare expression at different stages and to other cell types Results: midline-specific transcripts high in midline cells when compared to levels in other tissues
Fluorescence Activated Cell Sorter (FACS) Allows isolation of fluorescently-labeled (GFP+) cells
Array Analysis of Gene Expression • Midline gene expression program > identify all genes expressed in midline cells • Study: function and regulation • Approaches: • Purify midline cells (GFP) > compare to other cell types and developmental time intervals • Mutant (sim) vs. wild-type • Misexpression of sim vs. wild-type • Transgenes – express in entire CNS • Genetics – snail mutant > express in entire mesoderm
Comparison of Wild-type to sim Mutant Embryos Wild-type sim Results: Expect to see midline gene expression reduced in sim mutant
Array Analysis of Gene Expression • Midline gene expression program > identify all genes expressed in midline cells • Study: function and regulation • Approaches: • Purify midline cells (GFP) > compare to other cell types and developmental time intervals • Mutant (sim) vs. wild-type • Misexpression of sim vs. wild-type • Transgenes – express in entire CNS • Genetics – snail mutant > express in entire mesoderm
Analysis of Midline Transcription by Ectopic Sim Expression: Transgenic Approaches Wild-type sca-Gal4 X UAS-sim-GFP a-Wrapper GFP a-Wrapper Result: Expect to see midline gene expression increased in sca-Gal4 X UAS-sim-GFP
Analysis of Midline Transcription by Ectopic Sim Expression: Genetic Approaches Wild-type sim RNA localization snail Result: Expect to see midline gene expression increased in snail mutant
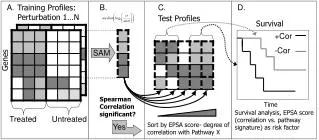
Cluster Analysis of Combined Data Sets • Compare different data sets • Midline genes • Test by in situ hybridization for midline expression
Array Analysis of Mesoderm Gene Expression • Mesoderm • Somatic muscles • Visceral muscles • Fat body, hemocytes • twist gene • Encodes transcription factor required for mesodermal gene expression • twist mutant – no mesoderm or mesodermal gene expression • twist overexpression (Toll10B mutation) – excess mesoderm and mesodermal gene expression
Mutant Embryo Purification • twist is embryonic lethal mutation • twi / + X twi / + only 25% embryos are mutant (twi / twi) • Use GFP-CyO chromosome and sort mutant embryos GFP-CyO / twi twi / twi GFP-CyO / GFP-Cyo
Mutant Sorting • GFP-labeled organisms • Hand sort with fluorescence microscope • Machine sort
Array Analysis: Clustering Confirm expected expression pattern by in situ hybridization