Download
1 / 27
270 likes | 387 Views
The Past and Future of European Energy Trading. Liberalisation of European electricity markets did not cause high prices…. End-user prices in Western Europe (1995-2004) (Source: Kema Consulting study for Eurelectric 2006). Bullet point Bullet point Bullet point Bullet point Bullet point

E N D
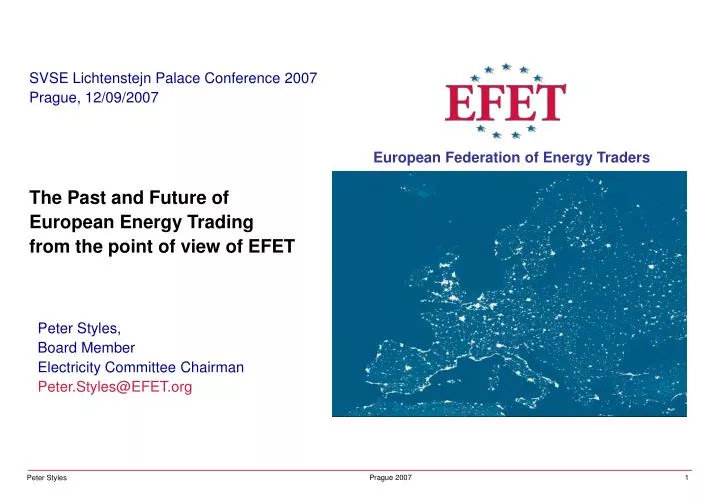
The Past and Future of European Energy Trading Liberalisation of European electricity markets did not cause high prices…
End-user prices in Western Europe (1995-2004) (Source: Kema Consulting study for Eurelectric 2006) • Bullet point • Bullet point • Bullet point • Bullet point • Bullet point • Bullet point • Bullet point • Bullet point
Industry power prices in Austria 1970-2001 • Text • Text • Text: text
The Past and Future of European Energy Trading Liberalisation of European electricity markets did not cause high prices …though remaining monopoly elements and free allocation of carbon allowances do not help!
Influence of different factors on the German wholesale power price (Source: Technical University Dresden)
German wholesale power price versus marginal costs on one day in April 2004(Source: Technical University Dresden)
The Past and Future of European Energy Trading There is no way back from free markets, except to central planning
Illustration of electricity market wholesale function Electricityinterconnectors Demand management Independent network operators I&C Customer choice Hub Local power HV transmission Residential LV distribution Market prices at trading hubs Competing producers (including ancillary services) Competing suppliers
Ingredients for successful liberalisation (1) Privatisation and liberalisation • Relationship between the government-owner and government as “sponsor” of regulator • Commitment to developing competition versus financial benefits to government-owner? • Timing, order? Unbundling • Ownership, management? • Balancing and other services for competitors ?
Ingredients for successful liberalisation (2) Liberalisation on the supply-side? • Divestiture of generating capacity by dominant incumbent may be necessary for competition to start • Auctioning of virtual power plants or long term contracts is possible second best Cross border trade is an important source of liquidity • Integration of neighbouring markets helps competition • Non discriminatory access to cross-border capacity is a challenge
Ingredients for successful liberalisation (3) Avoid hidden cross-subsidies • Bad experience with stranded costs and legacy contracts • Subsidies may be designed to not distort the market Regulators must communicate with market participants • It is impossible for a regulator to anticipate and understand all effects of its intervention or non-intervention; market participants are creative • Benefit of experience of regulators in earlier liberalised territories
The Past and Future of European Energy Trading Policymakers’ interference in market operation already causes distortions
Distortions of most concern to traders April 2007 Price caps or regulated tariffs imposed by national governments or regulators (power and gas) 76% of respondents have indicated it as a serious distortion National failures to implement EU Directives (power, emissions and gas)73% Improper or insufficient or non-firm allocation of transmission capacity (power and gas) 73% Mergers and protection of national champions 73% Lack of transparency about the use of infrastructure (power and gas)65% Uncertainty about CO2 emissions and allocation of allowances61.5% Access to transmission and storage (gas) 57.5% Ineffective or insufficient unbundling 57.5% Peter Styles
Desired priorities for EU energy policy • Completing the internal market and market integration, including harmonized and uniform regulatory framework in EU (14) • Unbundling, formation of an Independent Transmission Operator(6) • Development of gas markets, improving access to the gas infrastructures, changing business practices (4) • Merger control and preventing the anti-competitive behaviour (4) • Improving cross border trading: Increasing transmission capacity allocation, reduction of bottlenecks, common procedures (3) • Transparency (e.g. unused/used transportation capacity) (3) Styles, Oprea
The Past and Future of European Energy Trading Traders play a vital role in optimising use of infrastructure and enabling retail competition
Development of cross-border trading • Cross-border trading existed before liberalisation but in a discriminatory, non-transparent manner • NTC measure of cross-border transmission capacity outdated and overly restrictive • No real firmness in allocation of transmission capacity • Non-market-based allocation mechanisms persist • Tension between advocates of market coupling and proponents of physical OTC market flexibility • No financial transmission rights yet
Yearly explicit auction Monthly explicit auction Deadline for title transfer of rights (closure of SCRM) Deadline D-1 for use of the rights (UIOSI) Hourly H-1 intra-day deadline t Secondary Capacity Rights Market LT cross border nominations Continuous Cross Border intra-day M-n M-1 D-2 D-1 D Cross border trading timeline Daily implicit auction (deadline for exchange and clearing) D-1 deadline for internal nominations (TSO gateclosure) May 2006
Contrast between commercial and physical views of wholesale power supply (1) Operator's view (the “physical” dimension) • Balancing the system • Controlling the flows • Maintaining security (guaranteed?) Trader's view (the “commercial” dimension) • System is a market place with trading flexibility • Potential restrictions should be transparent Relationship between flows and commercial contracts
Contrast between commercial and physical views of wholesale power supply (2) • “Border flows” do not coincide with “border commercial exchanges” (known to traders as “nominations”) • Renewable power subsidies distort capacity allocation • Load and generation schedules needed for accurate prediction of commercial trading capacities • Schedules are fixed after end of all trades (within hubs and between them) • In order to trade between hubs, traders need to know the commerciallyavailable capacities ...
Allocate Less Reduced rebalancing Volume allocated is a commercial - not a technical - decision Must be consistent security standards Allocate more Increased rebalancing Capacity allocation Congestion management Actual flows
Traders play a vital role in optimising use of infrastructure and competition …and the way forward must include a secondary market in transmission capacity rights The Past and Future of European Energy Trading
Capacity allocation at D-1: Explicit auctions only Daily Capacity used OTC Use it Monthly/Quarterly Intraday Capacity market 2010 2009 2008 Annual Multi-Annual Time H-15mins H H H+30mins Annual capacity sale Use or sell term harmonised with Intra-day capacity to the energy market market starts market D-1 explicit allocation Options tradable in Obligations secondary market tradable in intraday market
Current usual practice “Wished” realistic practice Seasonal expected commercially available capacity 100% 100% 365*24h daily allocations per year 12% + seasonal variations 365*24h daily Allocations remaining 33% + seasonal variation 88% M + Q allocations per year for about 22 % 66% 66% 22 % yearly 44% multi year M + Q allocations 44% 33% 1 Y allocation Multi-year and yearly auctions held for proportional shares at different times in year; e.g. 4 auctions of 11% multi-year capacity and 4 auctions of 5.5 % yearly capacity, multi-year products and also Y+1, Y+2, Y+3, .. to be offered separately.
The Past and Future of European Energy Trading European Federation of Energy TradersTel: +31 (0)20 5207970Email: secretariat@efet.org www.efet.org