Download
1 / 15
150 likes | 153 Views
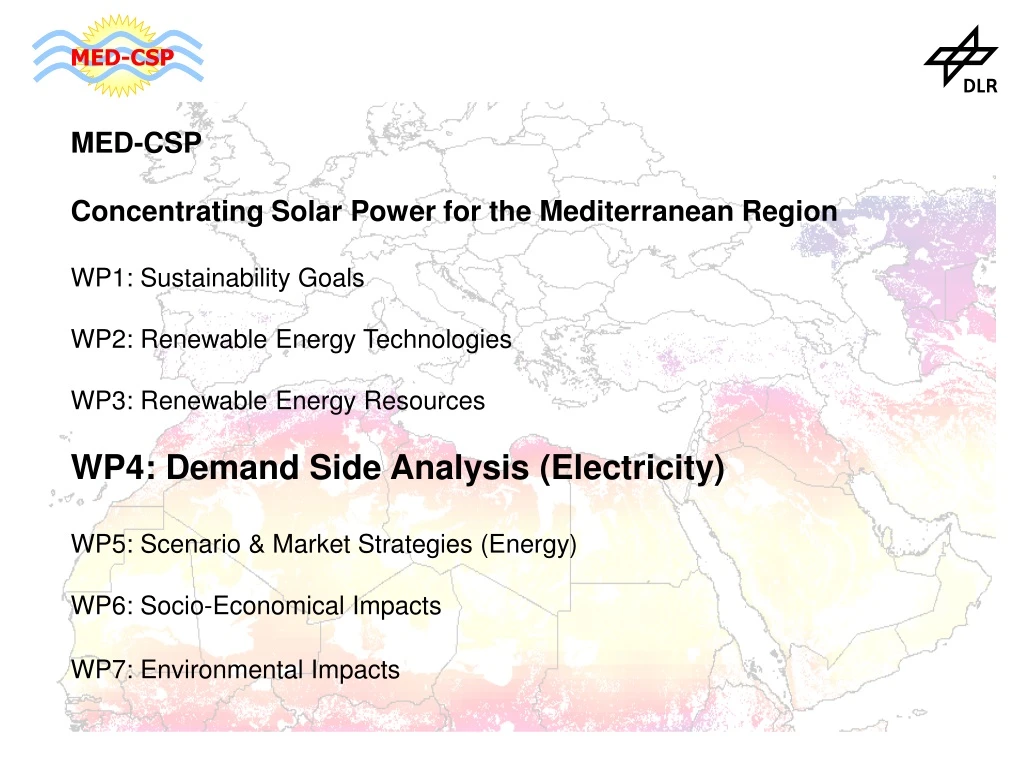
MED-CSP Concentrating Solar Power for the Mediterranean Region WP1: Sustainability Goals WP2: Renewable Energy Technologies WP3: Renewable Energy Resources WP4: Demand Side Analysis (Electricity) WP5: Scenario & Market Strategies (Energy) WP6: Socio-Economical Impacts

E N D
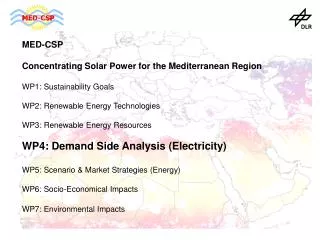
MED-CSP Concentrating Solar Power for the Mediterranean Region WP1: Sustainability Goals WP2: Renewable Energy Technologies WP3: Renewable Energy Resources WP4: Demand Side Analysis (Electricity) WP5: Scenario & Market Strategies (Energy) WP6: Socio-Economical Impacts WP7: Environmental Impacts
Demand Side Assessment The MED-CSP scenario considers the individual situation of each country concerning population growth, economic growth and energy requirements. It assumes economic growth rates sufficiently high to close the gap with the USA per capita national income by 50 % until 2050. That means that most MENA countries will achieve a per capita income equivalent to the present central EU states by 2050. This good economic development goes together with efficiency gains in the electricity sector, leading to a slightly slower growth of demand in the coming decade. After 2040, a saturation of electricity demand will be visible in most countries. The scenario is called “Closing the Gap, High Efficiency Gains”, CG/HE. Most Maghreb and Western Asia countries are already well on this track. Egypt would have to accelerate economic growth a little bit. Yemen would require economic growth of 11 %/year for 40 years to achieve this goal, which is rather unrealistic. Therefore, the economic growth rate has been limited to a maximum of 7 %. A scenario with lower economic growth was also assessed, maintaining the present per capita income gap to the USA. However, the electricity requirements would be even higher in this case after 2030, because efficiency gains could not be performed due to the restricted economic situation. The following figure shows the gross electricity consumption of all countries analysed within the study since 1980. The scenario CG/HE fits particularly well to the historical data. While the European countries and the OPEC countries of the Arabian Peninsula show a clear saturation of electricity demand after 2030, most other MENA countries will have a strongly growing electricity demand, with Egypt, Turkey and Iran becoming the biggest centres of demand. The total gross electricity demand of the analysed countries has grown by 3 times in 20 years, from 500 TWh/year in 1980 to 1500 TWh/year in 2000, with an average annual growth of 50 TWh/year. The scenario calculation yield a growth of again shortly 3 times in the coming 50 years, to 4100 TWh/year in 2050. This results in an average annual growth of 52 TWh/year.
Second Slowdown: Demand Stabilisation First Slowdown: Efficiency Gains & Liberalisation Gross Electricity Consumption of the Countries analysed within MED-CSP
Development Trends of Population Growth Rates in the Countries analysed within MED-CSP
Development Trends of Population in the Regions analysed within MED-CSP
4 Scenario Variations for Economic Growth: CG/HE Closing 50 % of the per Capita GDP Gap with USA by 2050 High Efficiency of the Power Sector CG/LE Closing 50 % of the per Capita GDP Gap with USA by 2050 Low Efficiency of the Power Sector FU/HE Following Up with the per Capita GDP Gap with USA until 2050 High Efficiency of the Power Sector FU/LE Following Up with the per Capita GDP Gap with USA until 2050 Low Efficiency of the Power Sector
Average per Capita GDP Growth Rates 2003 – 2050 within the Scenario CG/HE
Development of per Capita GDP until 2050 within the Scenario CG/HE
2040 2020 Electricity/Capita [kWh/cap] 2000 y = a xb b = linear HE b = expon. LE 1980 1960 GDP/Capita [1000 US$ 1996 PPP] Correlation and Extrapolation of Total Final Electricity Consumption per capita and GDP per capita for a Sample of 25 (150) Countries
Scenario for Germany REF SUS Per Capita Power Consumption on the Arabian Peninsula (CG/HE)
Per Capita Power Consumption in Mediterranean Europe (CG/HE)
Average annual Growth rates of GDP and GDP/capita in both scenarios and between 1990 and 2000 (in %)