Download
1 / 23
240 likes | 279 Views
DMPS measurements at Mount Waliguan, inland China. Niku Kivekäs NOSA 9.11.2007. Thanks and acknowledgements. Finnish Meteorological Institute: Heikki Lihavainen Mika Komppula Veli-Matti Kerminen Yrjö Viisanen. Chinese Academy of Meteorological Sciences: Jun-Ying Sun Ming-Jin Zhan.

E N D
DMPS measurements at Mount Waliguan, inland China Niku Kivekäs NOSA 9.11.2007
Thanks and acknowledgements • Finnish Meteorological Institute: • Heikki Lihavainen • Mika Komppula • Veli-Matti Kerminen • Yrjö Viisanen • Chinese Academy of Meteorological Sciences: • Jun-Ying Sun • Ming-Jin Zhan • Funding & Other: • Academy of Finland • Mount Waliguan Research Station Ilmatieteen laitos / PowerPoint ohjeistus
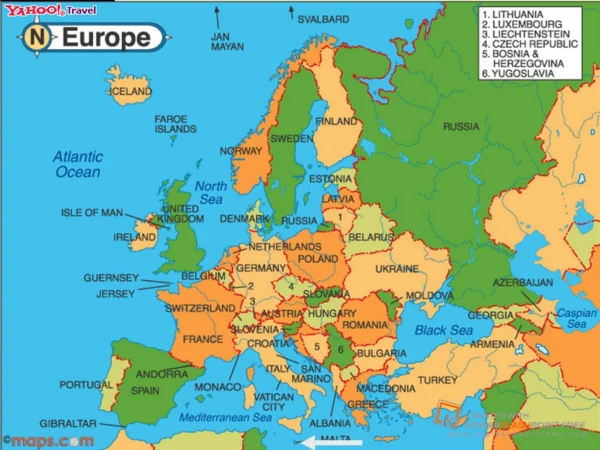
Mt Waliguan GAW station 36.283°N 100.900°E 3810 m a.s.l. (Highest Global GAW) Ilmatieteen laitos / PowerPoint ohjeistus
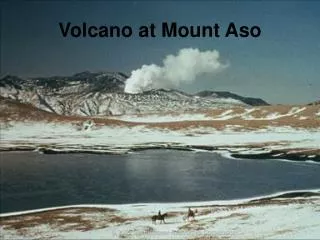
Mt Waliguan surroundings Ilmatieteen laitos / PowerPoint ohjeistus
Climate at Mount Waliguan Annual variation of T Seasonal wind distribution Ilmatieteen laitos / PowerPoint ohjeistus
Measurements at Mt Waliguan • Aerosol measurements: • Size distribution (2005-2007) • DMPS (9-600 nm) • CPC • Light absorption coefficient • Optical depth • Other measurements: • Greenhouse gases • Meteorology • Precipitation chemistry • Solar radiation • Ozone • Reactive gases Ilmatieteen laitos / PowerPoint ohjeistus
Mt waliguan data coverage Ilmatieteen laitos / PowerPoint ohjeistus
Annual variation of Np(mode) Ilmatieteen laitos / PowerPoint ohjeistus
Daily variation 1, Winter Ilmatieteen laitos / PowerPoint ohjeistus
Daily variation 2, Spring Ilmatieteen laitos / PowerPoint ohjeistus
Daily variation 3, Summer Ilmatieteen laitos / PowerPoint ohjeistus
Daily variation 4, Fall Ilmatieteen laitos / PowerPoint ohjeistus
Clustering the size distributions Ilmatieteen laitos / PowerPoint ohjeistus
Size distribution clusters Ilmatieteen laitos / PowerPoint ohjeistus
Sectors for trajectory analysis Sector 1 North Sector 4 Deserts Sector 2 China Sector 3 India / Tibet Ilmatieteen laitos / PowerPoint ohjeistus
Size distribution clusters from each sector (-24h) Ilmatieteen laitos / PowerPoint ohjeistus
Wind roses for each cluster Ilmatieteen laitos / PowerPoint ohjeistus
Conclusions • Air at Mt Waliguan has approximately 2300 particles (9-600 nm) / cm3 (at ambient pressure). • There is no clear seasonal pattern in Np. • There is a daily pattern of Np in nucleation (and partly Aitken) mode. The pattern is present at all seasons. • There is an air mass pattern in Np and the shape of the size distributions. Western air masses contain smaller particles than eastern air masses. • Local topography affects wind direction making the wind rose analysis different from trajectory analysis Ilmatieteen laitos / PowerPoint ohjeistus
Thank you for your attention Ilmatieteen laitos / PowerPoint ohjeistus
Size distribution types seasonally Ilmatieteen laitos / PowerPoint ohjeistus
Size distribution types monthly Ilmatieteen laitos / PowerPoint ohjeistus
Air mass history vs wind direction Ilmatieteen laitos / PowerPoint ohjeistus
Reasons for missing data 2-3 / 2006 7-8 / 2006 Ilmatieteen laitos / PowerPoint ohjeistus