Download
1 / 85
1.07k likes | 1.38k Views
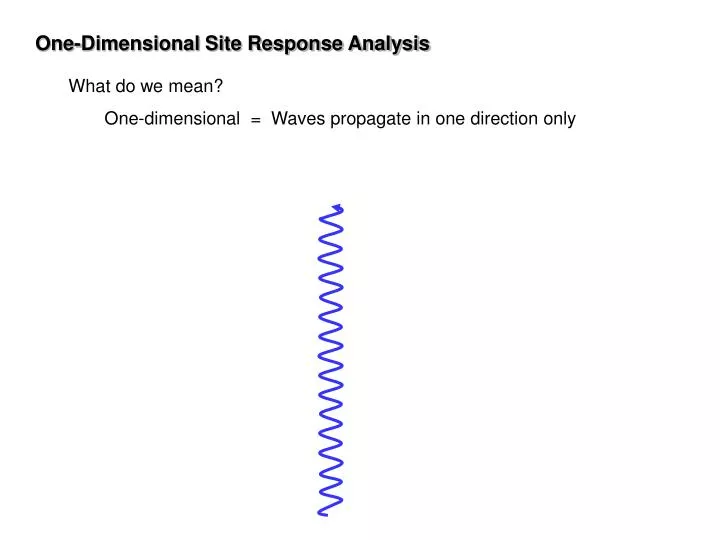
One-Dimensional Site Response Analysis. What do we mean? One-dimensional = Waves propagate in one direction only. One-Dimensional Site Response Analysis. What do we mean? One-dimensional = waves propagate in one direction only Motion is identical on planes perpendicular to that motion.

E N D
One-Dimensional Site Response Analysis • What do we mean? • One-dimensional = Waves propagate in one direction only
One-Dimensional Site Response Analysis • What do we mean? • One-dimensional = waves propagate in one direction only • Motion is identical on planes perpendicular to that motion to infinity to infinity
Horizontal input motion One-Dimensional Site Response Analysis • What do we mean? • One-dimensional = waves propagate in one direction only • Motion is identical on planes perpendicular to that motion • Can’t handle refraction so layer boundaries must be perpendicular to direction of wave propagation • Usual assumption is vertically-propagating shear (SH) waves Horizontal surface motion
One-Dimensional Site Response Analysis When are one-dimensional analyses appropriate? Stiffer with depth Focus
Decreasing stiffness causes refraction of waves to increasingly vertical path One-Dimensional Site Response Analysis When are one-dimensional analyses appropriate? Horizontal boundaries – waves tend to be refracted toward vertical Stiffer with depth Focus
One-Dimensional Site Response Analysis When are one-dimensional analyses appropriate? Not appropriate here Stiffer with depth
Dams and embankments One-Dimensional Site Response Analysis Not here! When are one-dimensional analyses appropriate? Retaining structures Inclined ground surface and/or non-horizontal boundaries can require use of two-dimensional analyses Tunnels
Dams in narrow canyons One-Dimensional Site Response Analysis Not here! When are one-dimensional analyses appropriate? Complex soil conditions Multiple structures Localized structures may require use of 3-D response analyses
Rock outcropping motion Free surface motion us 2ui Bedrock motion ui + ur Incoming motion ui One-Dimensional Site Response Analysis How should ground motions be applied? Soil Not the same! Rock
Free surface motion us One-Dimensional Site Response Analysis How should ground motions be applied? • Input (object) motion • If recorded at rock outcrop, apply as outcrop motion (program will remove free surface effect). Bedrock should be modeled as an elastic half-space. • If recorded in boring, apply as within-profile motion (recording does not include free surface effect). Bedrock should be modeled as rigid. Object motion
Single elastic layer Amplification De-amplification Methods of One-Dimensional Site Response Analysis • Complex Response Method • Approach used in computer programs like SHAKE • Transfer function is used with input motion to compute surface motion (convolution) • For layered profiles, transfer function is “built” layer-by-layer to go from input motion to surface motion
Layer j Layer j+1 Amplitudes of upward- and downward-traveling waves in Layer j At the boundary between layer j and layer j+1, compatibility of displacements requires that No slip Continuity of shear stresses requires that Equilibrium satisfied Complex Response Method (Linear analysis) Consider the soil deposit shown to the right. Within a given layer, say Layer j, the horizontal displacements will be given by
Complex Response Method (Linear analysis) Defining a*j as the complex impedance ratio at the boundary between layers j and j+1, the wave amplitudes for layer j+1 can be obtained from the amplitudes of layer j by solving the previous two equations simultaneously Propagation of wave energy from one layer to another is controlled by (complex) impedance ratio Wave amplitudes in Layer j Wave amplitudes in Layer j+1 So, if we can go from Layer j to Layer j+1, we can go from j+1 to j+2, etc. This means we can apply this relationship recursively and express the amplitudes in any layer as functions of the amplitudes in any other layer. We can therefore “build” a transfer function by repeated application of the above equations.
Complex Response Method (Linear analysis) • Single layer on rigid base • H = 100 ft • Vs = 500 ft/sec • x = 10%
Complex Response Method (Linear analysis) • Single layer on rigid base • H = 50 ft • Vs = 1,500 ft/sec • x = 10%
Complex Response Method (Linear analysis) • Single layer on rigid base • H = 100 ft • Vs = 300 ft/sec • x = 5%
Complex Response Method (Linear analysis) Different sequence of soil layers Different transfer function Different response
Complex Response Method (Linear analysis) Another sequence of soil layers Different transfer function Different response
Principle of superposition t Linear system g Complex Response Method (Linear analysis) • Complex response method operates in frequency domain • Input motion represented as sum of series of sine waves • Solution for each sine wave obtained • Solutions added together to get total response Can we capture important effects of nonlinearity with linear model?
x Equivalent damping ratio Equivalent shear modulus Equivalent Linear Approach Soils exhibit nonlinear, inelastic behavior under cyclic loading conditions Stiffness decreases and damping increases as cyclic strain amplitude increases The nonlinear, inelastic stress-strain behavior of cyclically loaded soils can be approximated by equivalent linear properties.
Equivalent Linear Approach Soils exhibit nonlinear, inelastic behavior under cyclic loading conditions Stiffness decreases and damping increases as cyclic strain amplitude increases The nonlinear, inelastic stress-strain behavior of cyclically loaded soils can be approximated by equivalent linear properties. x g(1) g(1) Assume some initial strain and use to estimate G and x
g(t) t Equivalent Linear Approach Soils exhibit nonlinear, inelastic behavior under cyclic loading conditions Stiffness decreases and damping increases as cyclic strain amplitude increases The nonlinear, inelastic stress-strain behavior of cyclically loaded soils can be approximated by equivalent linear properties. x g(1) g(1) Use these values to compute response
g(t) t Equivalent Linear Approach Soils exhibit nonlinear, inelastic behavior under cyclic loading conditions Stiffness decreases and damping increases as cyclic strain amplitude increases The nonlinear, inelastic stress-strain behavior of cyclically loaded soils can be approximated by equivalent linear properties. gmax geff x g(1) g(1) Determine peak strain and effective strain geff = Rggmax
Equivalent Linear Approach Soils exhibit nonlinear, inelastic behavior under cyclic loading conditions Stiffness decreases and damping increases as cyclic strain amplitude increases The nonlinear, inelastic stress-strain behavior of cyclically loaded soils can be approximated by equivalent linear properties. x g(1) g(2) g(1) g(2) Select properties based on updated strain level
Equivalent Linear Approach Soils exhibit nonlinear, inelastic behavior under cyclic loading conditions Stiffness decreases and damping increases as cyclic strain amplitude increases The nonlinear, inelastic stress-strain behavior of cyclically loaded soils can be approximated by equivalent linear properties. x g(1) g(3) g(2) g(1) g(2) g(3) Compute response with new properties and determine resulting effective shear strain
Equivalent Linear Approach Soils exhibit nonlinear, inelastic behavior under cyclic loading conditions Stiffness decreases and damping increases as cyclic strain amplitude increases The nonlinear, inelastic stress-strain behavior of cyclically loaded soils can be approximated by equivalent linear properties. x geff geff Repeat until computed effective strains are consistent with assumed effective strains
… often, a very good one! Equivalent Linear Approach • Advantages: • Can work in frequency domain • Compute transfer function at relatively small number of frequencies (compared to doing calculations at all time steps) • Increased speed not that significant for 1-D analyses • Increased speed can be significant for 2-D, 3-D analyses • Equivalent linear properties readily available for many soils – familiarity breeds comfort/confidence • Can make first-order approximation to effects of nonlinearity and inelasticity within framework of a linear model The equivalent linear approach is an approximation. Nonlinear analyses are capable of representing the actual behavior of soils much more accurately.
Nonlinear Analysis Equation of motion must be integrated in time domain Wave equation for visco-elastic medium Divide time into series of time steps t Divide profile into series of layers z
Nonlinear Analysis Equation of motion must be integrated in time domain Wave equation for visco-elastic medium tj Divide time into series of time steps t zi Divide profile into series of layers vij = v (z = zi, t = tj) z
Nonlinear Analysis Equation of motion must be integrated in time domain Wave equation for visco-elastic medium tj t More steps, but basic process involves using wave equation to predict conditions at time j+1 from conditions at time j for all layers in profile. zi z
Nonlinear Analysis Equation of motion must be integrated in time domain Wave equation for visco-elastic medium tj t More steps, but basic process involves using wave equation to predict conditions at time j+1 from conditions at time j for all layers in profile. zi Can change material properties for use in next time step. Changing stiffness based on strain level, strain history, etc. can allow prediction of nonlinear, inelastic response. z
Nonlinear Analysis Equation of motion must be integrated in time domain Wave equation for visco-elastic medium tj t More steps, but basic process involves using wave equation to predict conditions at time j+1 from conditions at time j for all layers in profile. zi Can change material properties for use in next time step. Changing stiffness based on strain level, strain history, etc. can allow prediction of nonlinear, inelastic response. z
Nonlinear Analysis Equation of motion must be integrated in time domain Wave equation for visco-elastic medium tj t More steps, but basic process involves using wave equation to predict conditions at time j+1 from conditions at time j for all layers in profile. zi Can change material properties for use in next time step. Changing stiffness based on strain level, strain history, etc. can allow prediction of nonlinear, inelastic response. z
Nonlinear Analysis Equation of motion must be integrated in time domain Wave equation for visco-elastic medium tj t More steps, but basic process involves using wave equation to predict conditions at time j+1 from conditions at time j for all layers in profile. zi Can change material properties for use in next time step. Changing stiffness based on strain level, strain history, etc. can allow prediction of nonlinear, inelastic response. z
Nonlinear Analysis Equation of motion must be integrated in time domain Wave equation for visco-elastic medium tj t More steps, but basic process involves using wave equation to predict conditions at time j+1 from conditions at time j for all layers in profile. zi Step through time Can change material properties for use in next time step. Changing stiffness based on strain level, strain history, etc. can allow prediction of nonlinear, inelastic response. Procedure steps through time from beginning of earthquake to end. z
Continuous Linear segments Nonlinear Behavior Actual Approximation t t g g In a nonlinear analysis, we approximate the continuous actual stress-strain behavior with an incrementally-linear model. The finer our computational interval, the better the approximation.
Liquefaction Nonlinear Approach • Advantages: • Work in time domain • Can change properties after each time step to model nonlinearity • Can formulate model in terms of effective stresses • Can compute pore pressure generation • Can compute pore pressure redistribution, dissipation • Avoids spurious resonances (associated with linearity of EL approach) • Can compute permanent strain permanent deformations Nonlinear analyses can produce results that are consistent with equivalent linear analyses when strains are small to moderate, and more accurate results when strains are large. They can also do important things that equivalent linear analyses can’t, such as compute pore pressures and permanent deformations.
Equivalent Linear vs. Nonlinear Approaches What are people using in practice? • Equivalent linear analyses • One-dimensional – • 2-D / 3-D – SHAKE QUAD4, FLUSH • Nonlinear analyses • One-dimensional – • 2-D / 3-D – DESRA, DMOD TARA, FLAC, PLAXIS
Equivalent Linear vs. Nonlinear Approaches What are people using in practice? • Equivalent linear analyses • One-dimensional – • 2-D / 3-D – SHAKE QUAD4, FLUSH • Nonlinear analyses • One-dimensional – • 2-D / 3-D – DESRA TARA
Available Codes Since early 1970s, numerous computer programs developed for site response analysis Can be categorized according to computational procedure, number of dimensions, and operating system
55 responses • Western North America (WNA) • Eastern North America (ENA) • Overseas Private firms Public agencies Current Practice Informal survey developed to obtain input on site response modeling approaches actually used in practice • Emailed to 204 people • Attendees at ICSDEE/ICEGE Berkeley conference (non-academic) • Geotechnical EERI members – 2003 Roster (non-academic)
Current Practice Method of Analysis Of the total number of site response analyses you perform, indicate the approximate percentages that fall within each of the following categories: [ ] a. One-dimensional equivalent linear [ ] b. One-dimensional nonlinear [ ] c. Two- or three-dimensional equivalent linear [ ] d. Two- or three-dimensional nonlinear One-dimensional equivalent linear analyses dominate North American practice; nonlinear analyses are more frequently performed overseas
u(0,t) 1 m Ts = 0.4 sec 15 m 29 m u(H,t) Topanga record (Northridge) Topanga record (Northridge) Nonlinear Behavior Equivalent linear vs nonlinear analysis – how much difference does it make? Vs = 300 m/sec 30 m Vs = 762 m/sec
Nonlinear Behavior Equivalent linear vs nonlinear analysis – how much difference does it make? Topanga motion scaled to 0.05 g Weak motion + stiff soil Low strains Low degree of nonlinearity Similar response
Nonlinear Behavior Equivalent linear vs nonlinear analysis – how much difference does it make? Topanga motion scaled to 0.05 g Weak motion + stiff soil Low strains Low degree of nonlinearity Similar response
Nonlinear Behavior Equivalent linear vs nonlinear analysis – how much difference does it make? Topanga motion scaled to 0.05 g Weak motion + stiff soil Low strains Low degree of nonlinearity Similar response
Nonlinear Behavior Equivalent linear vs nonlinear analysis – how much difference does it make? Topanga motion scaled to 0.05 g Weak motion + stiff soil Low strains Low degree of nonlinearity Similar response
Relatively low strains Relatively low degree of nonlinearity Similar response Nonlinear Behavior Equivalent linear vs nonlinear analysis – how much difference does it make? Topanga motion scaled to 0.20 g Moderate motion + stiff soil