Download
1 / 19
210 likes | 410 Views
Bubbles and Crashes. Dilip Abreu and Markus K.Brunnermeier Econometrica (January, 2003) Presented by: Natalia Chetveryk. Notorious examples of bubbles followed by crashes:. 1630’s – Dutch Tulip Mania; 1719-1720 – South Sea Bubble; 1995-2000 – “Dot-Com” Bubble;

E N D
Bubbles and Crashes Dilip Abreu and Markus K.Brunnermeier Econometrica (January, 2003) Presented by: Natalia Chetveryk
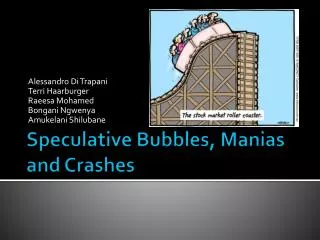
Notorious examples of bubbles followed by crashes: • 1630’s – Dutch Tulip Mania; • 1719-1720 – South Sea Bubble; • 1995-2000 – “Dot-Com” Bubble; • Real Estate Bubbles (occur periodically).
Typical Story of Technology Shock • Company X introduce a revolutionary wireless communication technology • The IPO price was 1.50$ per share. In a few years it was traded for 85.50$ and later on it hit 114$ per share. • The P/E ratio got as high as 73. • The company never paid dividends.
Company:RCA- Radio Corporation of America Technology: RadioYear: 1920’s • It peaked at $ 397 in Feb. 1929, down to $ 2.62 in May 1932
Model Scenario • Backdrop of analysis: a world with “behavioral” agents,subject to animal spirits, fads and fashion, overconfidence and related psychological biases… • Rational arbitrageurs understand that the bubble exists and market will eventually collapse,but want to “beat the gun” and exit the market just prior to crash. • They come up with different optimal solutions to timing problem => dispersion of exit strategies and lack of synchronization allow bubble to exist. • Bubble bursts due to selling pressure of arbitrageurs or due to exogenous reasons
Do (rational) professionals ride the bubble? South Sea Bubble (1710 - 1720) • Isaac Newton: • April 20, 1720 – sold shares at £ 7,000 after making a £ 3,500 profit; • Re-entered the market and lost £ 20,000 at the end.Frustrated, he concluded: “I can calculate the motions of heavenly bodies, but cannot predict the madness of people” Internet Bubble (1995-200) • Stanley Druckenmiller, manager of George Soros’ Quantum Fund, didn’t think that “the party will end so soon”. Faced with mounting losses he resigned in April, 2000. • Julian Roberts, manager of “Tiger Hedge Fund”, refused to invest in the technology stocks, since he thought they were overvalued.
Timing Game • Coordination – at least a fraction of k of arbitrageurs need to sell out in order for the bubble to burst (cooperative aspect. • Competition – at most a fraction of k can leave the market prior to the crash! • Profitable Ride – ride the bubble (stay in the market) as long as possible. • Sequential Awareness:-> Absent of SA -> competitive element dominates and bubble bursts immediately;-> With SA -> incentive to time the market leads to persistence of the bubble
Model Setup The price is kept above the fundamental by “irrationally exuberant” behavioral traders • t0 is exponentially distributed with cumulative function Φ(t0)=1-exp(-λ t0) Until time t0 price increase is justified by fundamental developments
Mechanics of Sequential of Awareness • A new cohort of rational arbitrageurs (of mass 1/ŋ) becomes aware of the mispricing in each instant t from t0; • The “awareness window” [t0, t0 + ŋ]; • An agent has a posterior distribution for t0 with support [ti – ŋ, ti]; • Truncated distribution of t0 is:
Model Setup • A trader may exit and return to the market multiple times -> But! Arbitrageurs incur transaction costs whenever they alter their position; • Financial constraint is binding; action space of the agent: [0,1]-> 0 is a max long position;-> 1 is max short position. • Selling pressure of arbitrageur i: σ(t, ti) => aggregate selling pressure: s(t, t0) = • The bursting time of the bubble for a given realization of t0. • The execution prices of the orders are either the pre-crash price p(t) or post-crash price => The expected execution price of the order: where α=0 if the selling pressure is less than or equal to k.
Preliminary Analysis of Equilibrium • Definition 1:Trading Equilibrium can be defined as Perfect Bayesian Nash Equilibrium in which trader i who attacks at time t believes that all traders who became aware of the bubble prior to him also attack at t. • Lemma 1: In equilibrium an arbitrageur is either fully invested in the market σ(t, ti) = 0, or at his maximum short-position σ(t, ti) =1. • Corollary 1: When arbitrageur ti sells out his shares, then all arbitrageurs tJ where tJ ≤ ti also have already sold their shares. • Definition 2: The function T(ti) = inf {t | σ(t, ti) > 0} denotes the first instant at which arbitrageur ti sells out any of her shares. • Corollary 2: The bubble bursts at
Preliminary Analysis of Equilibrium • Lemma 2 (Preemption): In equilibrium, arbitrageur ti believes at time T(ti) that at most a mass k of arbitrageurs became aware of the bubble prior to him (otherwise –> incentive to sell out earlier). Every arbitrageur i believes that the bubble bursts with probability zero at the instant T(ti). • Proposition 1 (Trigger-strategy): In equilibrium, arbitrageur ti maintains the maximum short position for all t ≥ T(ti), until the bubble bursts. • Lemma 7 (Sell-out Condition): If arbitrageur’s subjective hazard rate is smaller than the ‘cost-benefit’ ratio then trader will choose to hold maximum long position at t. Conversely, he’ll trade to the maximum short position: • Π(t|ti) – arbitrageur ti‘s conditional cumulative distribution function of the bursting date at time ti;π(t|ti) – its associated conditional density. where
Exogenous Crashes If then in the unique trading equilibrium the bubble only bursts for exogenous reasons when it reaches its max size β • The length of time that arbitrageurti is riding a bubble: • Posterior distribution over bursting dates t = ti + τ is: • The corresponding hazard rate: • By sell-out condition, arbitrageur ti is out of the market for .
Endogenous Crashes If then there exists a unique trading equilibrium, in which a bubble bursts for endogenous reasons. • In this equilibrium arbitrageur ti with ti >ŋκ leave the market periods after they become aware of the bubble. • All arbitrageurs ti < ŋκ sell out at ŋκ + τ*; • The bubble bursts when it is a fraction β* of the pre-crash price:
Synchronizing Events Important implications of the analysis: • News may have an impact disproportionate to any intrinsic (fundamental) informational content. -> News can serve as a synchronization device. • Fads & fashion may arise in the use of different kinds of information • Synchronizing events facilitate “coordinated attacks”; when attacks fail, the bubble is temporarily strengthened.
Uninformative Events • News serve as coordination device -> arrive with zero probability; • ≥ 0 - events are observed by traders who became aware of the bubble before; • > 0 -> captures the idea that arbitrageurs become more wary the more they are aware of the bubble => look out more vigilantly for signals that might precipitate the bursting of the bubble; • A ‘Responsive Equilibrium’ is a trading equilibrium in which each arbitrageur believes that all other traders will synchronize (sell out) at each synchronizing event; • Unique ‘RE’: each arbitrageur ti always sells out at the instances of SE. But, if the last synchronized attack failed, arbitrageur reenters the market. In the absence of SE arbitrageur stays for fixed number of periods and then sells out.
Price Events • Temporary price drops occur due to mood changes by behavioral traders (with Poisson density θ); • A large price decline => full blown crash or rebound; • No transaction costs, but leaving the market is costly due to temporary (if so) price drop. • The traders observe the history of price drops in the past (Hp); • Only traders who became aware of the mispricing more then periods earlier will leave the market; • denotes how long each arbitrageur rides the bubble after ti if there has been no price drop so far. • after a rebound, an endogenous crash can be temporarily ruled out and hence, arbitrageurs re-enter the market.
Conclusion: • Bubbles • Dispersion of opinion among arbitrageurs causes a synchronization problem which makes coordinated price corrections difficult. • Arbitrageurs time the market and ride the bubble. • Bubbles persist. • Crashes • can be triggered by unanticipated news without any fundamental content, since • it might serve as a synchronization device. • Rebound • can occur after a failed attack, which temporarily strengthens the bubble.