Download
1 / 1
10 likes | 155 Views
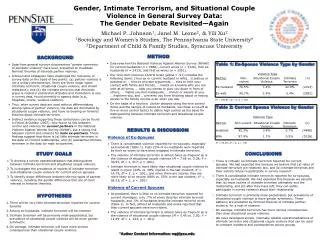
“Weight Affects Various People in Relation to Ethnicity, Age, and Class Standing” ??? ? ??? University of Nebraska-Lincoln. Table 1 Summary statistics, correlations and results Variable mean std Correlation b (β) Full model Demographic Model Daily Habits Model

E N D
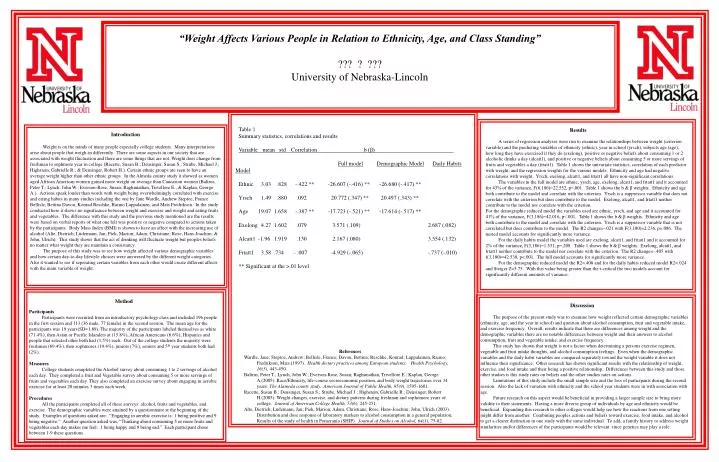
“Weight Affects Various People in Relation to Ethnicity, Age, and Class Standing” ??? ? ??? University of Nebraska-Lincoln Table 1 Summary statistics, correlations and results Variable mean std Correlation b (β) Full modelDemographic ModelDaily Habits Model Ethnic 3.03 .828 -.422 ** -26.607 (-.416) ** -26.680 (-.417) ** Yrsch 1.49 .880 .092 20.772 (.347) ** 20.497 (.343) ** Age 19.07 1.658 -.387 ** -17.723 (-.521) ** -17.614 (-.517) ** Exelong 4.27 1.602 .079 3.571 (.109) 2.687 (.082) Alcatt1 -1.96 1.919 .130 2.167 (.080) 3.554 (.132) Frtatt1 3.58 .734 - .007 -4.929 (-.065) -.737 (-.010) ** Significant at the >.01 level Results Introduction Weight is on the minds of many people especially college students. Many interpretations arise about people that weigh-in differently. There are some aspects in our society that are associated with weight fluctuation and there are some things that are not. Weight does change from freshman to sophmore year in college (Racette, Susan B.; Deusinger, Susan S.; Strube, Michael J.; Highstein, Gabrielle R.; & Deusinger, Robert H.). Certain ethnic groups are seen to have an average weight higher than other ethnic groups. In the Almeda county study it showed as women aged African American women gained more weight on average than Caucasion women (Baltrus, Peter T.; Lynch, John W.; Everson-Rose, Susan; Raghunathan, Trivellore E.; & Kaplan, George A.). Actions speak louder than words with weight being overwhelmingly correlated with exercise and eating habits in many studies including the one by Jane Wardle, Andrew Steptoe, France Bellisle, Bettina Davou, Konrad Reschke, Raimo Lappalainen, and Mats Fredrikson. In the study conducted here it shows no significance between weight and exercise and weight and eating fruits and vegetables. The difference with this study and the previous study mentioned are the results were based on verbal reports of what one felt was positive or negative compared to actions taken by the participants. Body Mass Index (BMI) is shown to have an affect with the increasing use of alcohol (Alte, Dietrich; Lüdemann, Jan; Piek, Marion; Adam, Christiane; Rose, Hans-Joachim; & John, Ulrich). This study shows that the act of drinking will fluctuate weight but peoples beliefs no matter what weight they are maintain a consistancy. The purpose of this study was to see how weight affected various demographic variables and how certain day-to-day lifestyle choices were answered by the different weight categories. Also it wanted to see if seperating certain variables from each other would create different affects with the main variable of weight. A series of regression analyses were run to examine the relationships between weight (criterion variable) and the predicting variables of ethnicity (ethnic), year in school (yrsch), subjects age (age), how long they have exercised if they do (exelong), positive or negative beliefs about consuming 1 or 2 alcoholic drinks a day (alcatt1), and positive or negative beliefs about consuming 5 or more servings of fruits and vegetables a day (frtatt1). Table 1 shows the univariate statistics, correlation of each predictor with weight, and the regression weights for the various models. Ethnicity and age had negative correlations with weight. Yrsch, exelong, alcatt1, and frtatt1 all have non-significant correlations. The variables in the full model are ethnic, yrsch, age, exelong, alcatt1, and frtatt1 and it accounted for 43% of the variance, F(6,186)=22.552, p<.001. Table 1 shows the b & β weights. Ethnicity and age both contribute to the model and correlate with the criterion. Yrsch is a suppressor variable that does not correlate with the criterion but does contribute to the model. Exelong, alcatt1, and frtatt1 neither contribute to the model nor correlate with the criterion. For the demographic reduced model the variables used are ethnic, yrsch, and age and it accounted for 41% of the variance, F(3,186)=42.016, p<.001. Table 1 shows the b & β weights. Ethnicity and age both contribute to the model and correlate with the criterion. Yrsch is a suppressor variable that is not correlated but does contribute to the model. The R2 change=-.021 with F(3,180)=2.236, p=.086. The nested model accounts for significantly more variance. For the daily habits model the variables used are exelong, alcatt1, and frtatt1 and it accounted for 2% of the variance, F(3,186)=1.531, p=.208. Table 1 shows the b & β weights. Exelong, alcatt1, and frtatt1 neither contribute to the model nor correlate with the criterion. The R2 change=-.405 with f(3,180)=42.530, p<.001. The full model accounts for significantly more variance. For the demographic reduced model the R2=.408 and for the daily habits reduced model R2=.024 and Steiger Z=5.75. With this value being greater than the t-critical the two models account for significantly different amounts of variance. Method Discussion Participants Participants were recruited from an introductory psychology class and included 196 people in the first session and 113 (36 male, 77 female) in the second session. The mean age for the participants was 19 years(SD=1.89). The majority of the participants labeled themselves as white (71.4%), then Asian or Pacific Islanders at (15.8%), African Americans (6.6%), Hispanics and people that selected other both had (1.5%) each. Out of the college students the majority were freshman (69.4%), then sophmores (19.4%), juniors (7%), seniors and 5th year students both had (2%). Measures College students completed the Alcohol survey about consuming 1 to 2 servings of alcohol each day. They completed a fruit and Vegetable survey about consuming 5 or more servings of fruits and vegetables each day. They also completed an exercise survey about engaging in aerobic exercise for at least 20 minutes 3 times each week. Procedures All the participants completed all of these surveys: alcohol, fruits and vegetables, and exercise. The demographic variables were attained by a questionnaire at the beginning of the study. Examples of questions asked are: “Engaging in aerobic exercise is: 1 being positive and 9 being negative.” Another question asked was, “Thinking about consuming 5 or more fruits and vegetables each day makes me feel: 1 being happy and 9 being sad.” Each participant chose between 1-9 these questions. The purpose of the present study was to examine how weight reflected certain demographic variables (ethnicity, age, and the year in school) and question about alcohol consumption, fruit and vegetable intake, and exercise frequency. Overall, results indicate that there are differences among weight and the demographic variables there are no notable differences between weight and their answers to alcohol consumption, fruit and vegetable intake, and exercise frequency. This study has shown that weight is not a factor when determining a persons exercise regimen, vegetable and fruit intake thoughts, and alcohol consumption feelings. Even when the demographic variables and the daily habit variables are compared separately toward the weight variable it does not influence their significance. Other research has shown significant results with the relationship of weight, exercise, and food intake and their being a positive relationship. Differences between this study and those other studies is this study rates on beliefs and the other studies rates on actions. Limitations of this study include the small sample size and the loss of participants during the second session. Also the lack of variation with ethnicity and the school year students were in with association with age. Future research on this aspect would be beneficial in providing a larger sample size to bring more validity to their statements. Having a more diverse group of individuals by age and ethnicity would be beneficial. Expanding this research to other colleges would help see how the reactions from one setting might differ from another. Combining peoples actions and beliefs toward exercise, food intake, and alcohol to get a clearer distinction in one study with the same individual. To add, a family history to address weight similarities and/or differences of the participants would be relevant since genetics may play a role. References Wardle, Jane; Steptoe, Andrew; Bellisle, France; Davou, Bettina; Reschke, Konrad; Lappalainen, Raimo; Fredrikson, Mats.(1997). Health dietary practices among European students. Health Psychology, 16(5), 443-450. Baltrus, Peter T.; Lynch, John W.; Everson-Rose, Susan; Raghunathan, Trivellore E.; Kaplan, George A.(2005). Race/Ethnicity, life-course socioeconomic position, and body weight trajectories over 34 years: The Alameda county study. American Journal of Public Health, 95(9), 1595-1601. Racette, Susan B.; Deusinger, Susan S.; Strube, Michael J.; Highstein, Gabrielle R.; Deusinger, Robert H.(2005). Weight changes, exercise, and dietary patterns during freshman and sophomore years of college. Journal of American College Health, 53(6), 245-251. Alte, Dietrich; Lüdemann, Jan; Piek, Marion; Adam, Christiane; Rose, Hans-Joachim; John, Ulrich.(2003). Distribution and dose response of laboratory markers to alcohol consumption in a general population; Results of the study of health in Pomerania (SHIP). Journal of Studies on Alcohol, 64(1), 75-82.