Download
1 / 83
830 likes | 838 Views
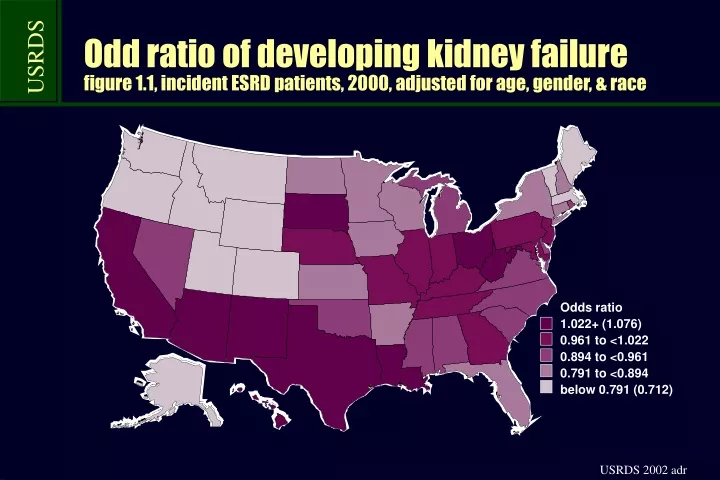
Odd ratio of developing kidney failure figure 1.1, incident ESRD patients, 2000, adjusted for age, gender, & race. Odds ratio 1.022+ (1.076) 0.961 to <1.022 0.894 to <0.961 0.791 to <0.894 below 0.791 (0.712).

E N D
Odd ratio of developing kidney failurefigure 1.1, incident ESRD patients, 2000, adjusted for age, gender, & race Odds ratio 1.022+ (1.076) 0.961 to <1.022 0.894 to <0.961 0.791 to <0.894 below 0.791 (0.712)
Incident ratesfigure 1.2, ESRD patients, 2000, by HSA, smoothed & adjusted for age, gender, & Hispanic ethnicity Rate per million population 383+ (481) 316 to <383 268 to <316 236 to <268 below 236 (206)
Prevalent ratesfigure 1.3, ESRD patients, 2000, by HSA, smoothed & adjusted for age, gender, & Hispanic ethnicity Rate per million population 1,450+ (1,892) 1,200 to <1,450 1,050 to <1,200 940 to <1,050 below 940 (844)
Incident patients: countstable 1.a, by modality, 2000 (cont.)
Incident patients: ratestable 1.b, by modality, 2000 (cont.)
Trends in incident rates & annual percent changefigure 1.4, rates adjusted for age, gender, & race Symbols: D% from previous year
Prevalent patient counts, by modality, 2000 table 1.c, December 31 point prevalent patients
Prevalent patient counts, by modality, 2000table 1.c, December 31 point prevalent patients (cont.)
Prevalent patient counts, by modality, 2000table 1.d, December 31 point prevalent patients
Prevalent patient counts, by modality, 2000table 1.d, December 31 point prevalent patients (cont.)
Trends in prevalent rates & annual % changefigure 1.5, December 31 point prevalent patients; rates adjusted for age, gender, & race Symbols: D% from previous year
Geographic variations in incident ESRD patientsfigure 1.6, incident rate, 1990, by HSA, unadjusted Per million population 370+ (371) 300 to <370 213 to <300 156 to <213 below 156 (135)
Geographic variations in incident ESRD patients figure 1.6, incident rate, 2000, by HSA, unadjusted Per million population 370+ (452) 300 to <370 213 to <300 156 to <213 below 156 (136
Geographic variations in incident rates of ESRD patients, & in growth over timefigure 1.6, 1990-1992, by HSA, unadjusted Percent change 33.3+ (45.1) 19.2 to <33.3 8.5 to <19.2 0 to <8.5 below 0 (-8.0)
Geographic variations in incident rates of ESRD patients, & in growth over timefigure 1.6, 1993-1995, by HSA, unadjusted Percent change 33.3+ (44.8) 19.2 to <33.3 8.5 to <19.2 0 to <8.5 below 0 (-7.0)
Geographic variations in incident rates of ESRD patients, & in growth over timefigure 1.6, 1996-1998, by HSA, unadjusted Percent change 33.3+ (45.0) 19.2 to <33.3 8.5 to <19.2 0 to <8.5 below 0 (-7.2)
Geographic variations in incident rates of ESRD patients, & in growth over timefigure 1.6, 1998-2000, by HSA, unadjusted Percent change 33.3+ (42.9) 19.2 to <33.3 8.5 to <19.2 0 to <8.5 below 0 (-9.3)
Trends in median age of incident patients, by race/ethnicityfigure 1.7, incident ESRD patients
Geographic variations in prevalent rates of ESRD patients, 1990figure 1.8, December 31 point prevalent ESRD patients, by HSA, unadjusted Per million population 1,375+ (1,393) 1,150 to <1,375 760 to <1,150 580 to <760 below 580 (506)
Geographic variations in prevalent rates of ESRD patients, 2000figure 1.8, December 31 point prevalent ESRD pts, by HSA, unadjusted Per million population 1,375+ (1,766) 1,150 to <1,375 760 to <1,150 580 to <760 below 580 (454)
Geographic variations in prevalent rates of ESRD patients, & in growth over time: 1990-1992figure 1.8, December 31 point prevalent ESRD pts, by HSA, unadjusted Percent change 21.3+ (28.1) 17.0 to <21.3 10.6 to <17.0 0 to <10.6 below 0 (-2.8)
Geographic variations in prevalent rates of ESRD patients, & in growth over time: 1993-1995figure 1.8, December 31 point prevalent ESRD pts, by HSA, unadjusted (cont.) Percent change 21.3+ (27.0) 17.0 to <21.3 10.6 to <17.0 0 to <10.6 below 0 (-2.5)
Geographic variations in prevalent rates of ESRD patients, & in growth over time: 1996-1998figure 1.8, December 31 point prevalent ESRD pts, by HSA, unadjusted Percent change 21.3+ (26.2) 17.0 to <21.3 10.6 to <17.0 0 to <10.6 below 0 (-3.3)
Geographic variations in prevalent rates of ESRD patients, & in growth over time: 1998-2000figure 1.8, December 31 point prevalent ESRD pts, by HSA, unadjusted (cont.) Percent change 21.3+ (25.9) 17.0 to <21.3 10.6 to <17.0 0 to <10.6 below 0 (-2.7)
Trends in median age of prevalent patients, by race/ethnicityfigure 1.9 Dialysis Transplant
Geographic variations in prevalent rates: dialysisfigure 1.10, 2000, by HSA, adjusted for age, gender, & race Per million population 1,070+ (1,265) 970 to <1,070 890 to <970 810 to <890 below 810 (725)
Geographic variations in prevalent rates: transplantfigure 1.10, 2000, by HSA, adjusted for age, gender, & race Per million population 416+ (499) 372 to <416 341 to <372 309 to <341 below 309 (280)
Geographic variations in prevalent rates of dialysis patients, by race/ethnicity: whitefigure 1.11, December 31 point prevalent patients, 2000, by HSA, unadjusted Per million population 1,090+ (1,224) 1,010 to <1,090 930 to <1,010 870 to <930 below 870 (788)
Geographic variations in prevalent rates of dialysis patients, by race/ethnicity: blackfigure 1.11, December 31 point prevalent patients, 2000, by HSA, unadjusted Per million population 3,670+ (4,046) 3,380 to <3,670 3,000 to <3,380 2,580 to <3,000 below 2,580 (2,267)
Geographic variations in prevalent rates of dialysis patients, by race/ethnicity: Native Americanfigure 1.11, December 31 point prevalent patients, 2000, by HSA, unadjusted Per million population 2,740+ (4,564) 2,000 to <2,740 1,530 to <2,000 1,210 to <1,530 below 1,210 (986)
Geographic variations in prevalent rates of dialysis patients, by race/ethnicity: Asianfigure 1.11, December 31 point prevalent patients, 2000, by HSA, unadjusted Per million population 1,200+ (1,374) 1,080 to <1,200 990 to <1,080 920 to <990 below 920 (834)
Geographic variations in prevalent rates of dialysis patients, by race/ethnicity: Hispanicfigure 1.11, December 31 point prevalent patients, 2000, by HSA, unadjusted Per million population 1,020+ (1,307) 840 to <1,020 700 to <840 580 to <700 below 580 (507)
Geographic variations in prevalent rates of dialysis pts, by race/ethnicity: non-Hispanicfigure 1.11, December 31 point prevalent patients, 2000, by HSA, unadjusted Per million population 1,510+ (1,928) 1,250 to <1,510 1,120 to <1,250 990 to <1,120 below 990 (867)
Trends in prevalent patient counts, by modality & race/ethnicityfigure 1.12, December 31, point prevalent patients Dialysis Transplant
Geographic variations in prevalent rates of dialysis patients, by race/ethnicity: 1990-2000, whitefigure 1.13, December 31 point prevalent patients, by HSA, unadjusted Percent change 125.0+ (152.0) 105.0 to <125.0 88.0 to <105.0 71.0 to <88.0 below 71.0 (56.0)
Geographic variations in prevalent rates of dialysis patients, by race/ethnicity: 1990-2000, blackfigure 1.13, December 31 point prevalent patients, by HSA, unadjusted Percent change 96.7+ (127.7) 77.9 to <96.7 62.0 to <77.9 46.3 to <62.0 below 46.3 (30.3)
Geographic variations in prevalent rates of dialysis patients, by race/ethnicity: 1990-2000, Native Am.figure 1.13, December 31 point prevalent patients, by HSA, unadjusted Percent change 211.0 (529.1) 112.5 to <211.0 65.9 to <112.5 31.6 to <65.9 below 31.6 (7.2)
Geographic variations in prevalent rates of dialysis patients, by race/ethnicity: 1990-2000, Asianfigure 1.13, December 31 point prevalent patients, by HSA, unadjusted Percent change 86.3+ (126.8) 61.5 to <86.3 43.9 to <61.5 31.5 to <43.9 below 31.5 (20.0)
Geographic variations in prevalent rates of dialysis patients, by race/ethnicity: 1990-2000, Hispanicfigure 1.13, December 31 point prevalent patients, by HSA, unadjusted Percent change 622+ (1,536) 510 to <622 422 to <510 361 to <422 below 361 (305)
Geographic variations in prevalent rates of dialysis patients, by race/ethnicity: 1990-2000, non-Hispanicfigure 1.13, December 31 point prevalent patients, by HSA, unadjusted Percent change 124.4+ (155.1) 98.8 to <124.4 80.2 to <98.8 57.9 to <80.2 below 57.9 (37.8)
Incident patient demographics, 1990-2000 table 1.e, by primary diagnosis & first modality: column percent
Incident patient demographics, 1990-2000 table 1.e, by primary diagnosis & first modality: column percent (cont.)
Trends in incident rates, by primary diagnosisfigure 1.14, adjusted for age, gender, race
Trends in incident rates, by race/ethnicityfigure 1.15, adjusted for age, gender, race
Trends in incident rates, by race/ethnicity & primary diagnosisfigure 1.16, adjusted for age & gender
Incident patient demographics, 1990-2000, by primary diagnosis & first modality: row percenttable 1.f
Incident patient demographics, 1990-2000, by primary diagnosis & first modality: row percenttable 1.f (cont.)
Geographic variations in incident rates, by primary diagnosis: diabetes, 1990figure 1.17, by HSA, unadjusted Per million population 205+ (260) 125 to <205 57 to <125 49 to <57 below 49 (44)