Download
1 / 7
70 likes | 196 Views
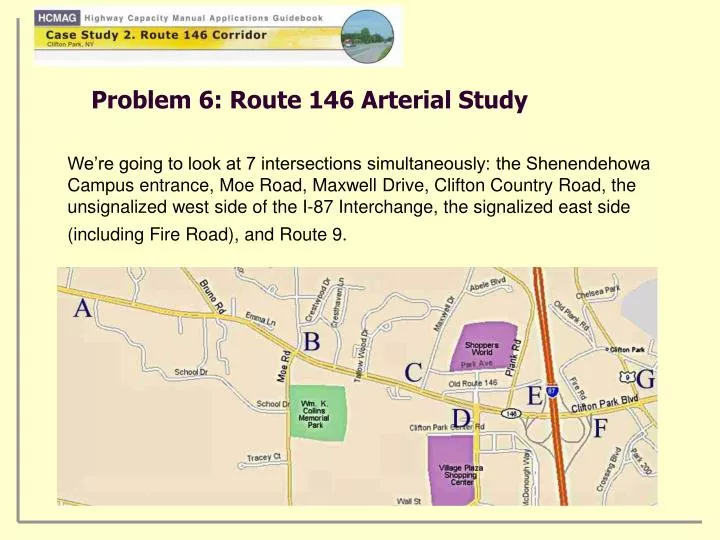
Problem 6: Route 146 Arterial Study . We’re going to look at 7 intersections simultaneously: the Shenendehowa Campus entrance, Moe Road, Maxwell Drive, Clifton Country Road, the unsignalized west side of the I-87 Interchange, the signalized east side (including Fire Road), and Route 9.

E N D
Problem 6: Route 146 Arterial Study We’re going to look at 7 intersections simultaneously: the Shenendehowa Campus entrance, Moe Road, Maxwell Drive, Clifton Country Road, the unsignalized west side of the I-87 Interchange, the signalized east side (including Fire Road), and Route 9.
We will focus on the PM peak hour. (PM with-site condition) • The intersection counts and signal timings we’ve obtained will be used as basic inputs to create a TRANSYT7-F (Version 9.5) simulation dataset. • We will exercise TRANSYT7-F in simulation mode to see how it thinks the network is performing. • Finally, we will use it to optimize the performance of the network as a coordinated system.
Saturation flow rates for each lane group • Volumes for each lane group • Signal timing plans (consistent with the HCM input datasets) • Distances between the intersections • Link-to-link movement patterns • Minimum phase lengths • Opposing links for the permitted lefts and the right turns that can move when there is no competing traffic, as at Clifton Country Road northbound What are the typical data requirements for this type of analysis?
HCM: from the HCM analysis Timings From: T7F1: hand-generated input to TRANSYT7-F to get acceptable v/c ratios for all of the lane groups T7F2: developed by TRANSYT-7F when it optimized coordinated operation across the network
At what locations were substantial timing changes necessary to improve the v/c ratio between the HCM and T7F1? Maxwell Drive and only for phases 1 and 3, all the others were very closely aligned!!! Other observations?
What have we learned? • The HCM analyses prepared us quite well for the network analysis. • TRANSYT-7F was able to improve the performance of the system (delay-wise) by only about 8%, when it optimized the signal timings. • The way the HCM treats these intersections is very similar to the way they are treated in TRANSYT-7F. The two analytical methods expect very similar inputs, treat the problem in similar ways, and produce similar outputs. • The one major difference between the HCM and models like TRANSYT-7F is that the capacities of the saturation flow rates are derived by the HCM, whereas they are inputs in the case of TRANSYT-7F. • Oftentimes, it helps to do the HCM analyses first and get credible saturation flow rates for the various lane groups before starting a TRANSYT-7F analysis.