Download

1 / 38
380 likes | 522 Views
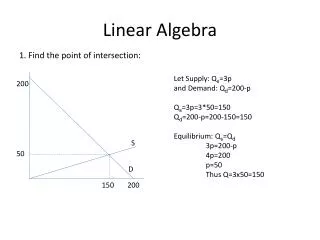
Going Beyond the Linear Function with Algebra I Students. Jim Rahn James.rahn@verizon.net www.Jamesrahn.com. What are some of the Common Core State Standards about Non-Linear Functions?. Functions can model many important phenomena.

E N D
Going Beyond the Linear Function with Algebra I Students Jim Rahn James.rahn@verizon.net www.Jamesrahn.com
What are some of the Common Core State Standards about Non-Linear Functions?
Functions can model many important phenomena. • Two important families of functions characterized by laws of growth are • linear functions, • which grow at a constant rate • with a constant term of zero describe proportional relationships • exponential functions • which grow at a constant percent rate.
Graph functions expressed symbolically and show key features of the graph, by hand in simple cases and using technology for more complicated cases • Graph exponential functions, showing intercepts and end behavior • Write a function defined by an expression in different but equivalent forms to reveal and explain different properties of the function.
Write a function that describes a relationship between two quantities. • Determine an explicit expression, a recursive process, or steps for calculation from a context. • Combine standard function types using arithmetic operations. • For example, build a function that models the temperature of a cooling body by adding a constant function to a decaying exponential, and relate these functions to the model.
Distinguish between situations that can be modeled with linear functions and with exponential functions. • Prove that linear functions grow by equal differences over equal intervals, and that exponential functions grow by equal factors over equal intervals. • Recognize situations in which a quantity grows or decays by a constant percent rate per unit interval relative to another.
Construct linear and exponential functions, including arithmetic and geometric sequences, given a graph, a description of a relationship, or two input-output pairs (include reading these from a table). • Observe, using graphs and tables, that a quantity increasing exponentially eventually exceeds a quantity increasing linearly, quadratically, or (more generally) as a polynomial function.
Interpret the parameters in a linear or exponential function in terms of a context. • Represent data on two quantitative variables on a scatter plot, and describe how the variables are related. • Fit a function to the data; use functions fitted to data to solve problems in the context of the data. • Use given functions or choose a function suggested by the context. Emphasize linear, quadratic, and exponential models.
Bugs, Bugs, Everywhere Bugs • Imagine that a bug population has invaded your classroom. • One day you noticed 16 bugs. • Every day new bugs hatch, increasing the population by 50% each week. • In the first week the population increases by 8 bugs.
Bugs, Bugs, Everywhere Bugs • Make a table to keep track of the number of bugsduring the first four weeks.
16 24 8 36 12 18 54 27 81 What do you notice about the increase in the number of bugs each week? Does this increase indicate linear growth? Why or why not?
16 24 8 36 12 18 54 27 81 Create a graph of the (weeks, total number of bugs) Connect the points with line segments. Describe how the slope changes from point to point.
Describe what is happening with the slope of the line segments? Slope = 27 bugs per week • How are the slopes of consecutive segments related? Slope = 18 bugs per week • What will eventually happen with the slope of these segments? Slope = 12 bugs per week Slope = 8 bugs per week
16 24 8 36 12 18 54 27 81 Find the ratio of this week’s total to last week’s total for the first four weeks.
16 24 8 36 12 18 54 27 81 What do you notice about the ratio of this week’s total to last week’s total? Explain what the ratios tell you about the bug population growth.
16 24 8 36 12 18 54 27 81 5 How can you use the ratio to calculate the population when 5 weeks have elapsed?
Write a recursive routine that models the populations growth for the growing number of bugs. Describe what each part of this calculator command does. By pressing ENTER a few times, check that your recursive routine gives the sequence of values in your table.
Making a slight change in the recursion formula helps keep track of the number of weeks and the bug population. Describe what each part of this calculator command does. By pressing ENTER a few times, check that your recursive routine gives the sequence of values in your table.
Use the routine to find the bug population at the end of weeks 5 to 8.
1.5 1.5 1.5 1.5 1.5 1.5 1.5 1.5 1.5 1.5 1.5 1.5 1.5 9
Explain how you would find the following: • What is the population after 20 weeks? • After 30 weeks? • What would the population, P, be on the nth week? (P=____) • What do you notice about the factors used in this equation? • What happens to the population in the long run?
What HAVE YOU LEARNED ABOUT Exponential Functions? • The rate of change in the population is not constant. – Therefore, the graph is not linear. • The ratio of two consecutive populations is constant. • Each previous rate of change is multiplied by the constant ratio to generate the consecutive rate of change. • The equation for the population has two factors • The initial population • The ratio raised to the power of n. GDB6
Comparing Growths • Maria has saved $10,000 and wants to invest it for her daughter’s college tuition. She is considering two options. • Plan A guarantees a payment, or return, of $550 each year. • Plan B grows by 5% each year. • With each plan, what would Maria’s new balance be after 5 years? After 10 years?
Plan A Write a recursive routine to do this on your calculator. Explicit equation:
Create a chart • Record your totals on the chart for Plan A for the first 20 years.
The factor 1+0.05 is called a constant multiplier Plan B Write a recursive routine to do this on your calculator. Explicit equation:
Create a chart • Record your totals on the chart for Plan B for the first 20 years.
Create a graph of Plan A vs. Plan B • Enter the data from the chart in your calculator. • Place the year in L1 • Balance for Plan A in L2 • Balance for Plan B in L3 • Create a graph of • L1 vs. L2 - Linear Growth • L1 vs. L3 - Exponential Growth • Compare the graphs. What statements can you make about the two graphs? PRGM MARIA
Example The factor 1-0.35 is called the constant multiplier. • Birdbaths at the Feathered Friends Store are marked down 35%. What is the cost of a birdbath that was priced $34.99? • What is the cost if the birdbath is marked down 35% a second time?
If the price of the birdbath is reduced 35% each time, what will be the cost after 6 reductions? • Write a recursive sequence for the cost of the birdbath. • Write an explicit equation that will give you the cost of the birdbath as a function of the number of reductions.
Explain the Meaning • We have looked at three different exponential equations. Explain the meaning of the three colored coded numbers.
Summary • Connecting both linear and non-linear functions to real world situations helps students understand the mathematics behind the problems better. • Equations take on new meaning. • The initial amount is a part of both equations • Numbers in the equations have meaning. • Behavior of the function is better understood through real world problems.