Download
1 / 23
230 likes | 429 Views
Microphysical variability of tropical and mid-latitude rainfall as revealed by polarimetric radar. S. Rutledge 1 , D. Wolff 2 , B. Dolan 1 , P. Kennedy 1 , W. Petersen 2 and V. Chandrasekar 1 Colorado State University NASA/Wallops Is. 2013 AGU Fall Meeting San Francisco, CA

E N D
Microphysical variability of tropical and mid-latitude rainfall as revealed by polarimetric radar S. Rutledge1, D. Wolff2, B. Dolan1, P. Kennedy1, W. Petersen2and V. Chandrasekar1 Colorado State University NASA/Wallops Is. 2013 AGU Fall Meeting San Francisco, CA 9-13 December 2013 Session H42A
Reflectivity-based rain estimation central to TRMM and GPM. • We will investigate the polarimetric radar derived “structure” of rainfall at several locations around the globe. These structures reveal regimes where the melting of graupel and hail contribute strongly to rainfall vs. where coalescence dominates (tropical warm rain). These structures reflect basic differences in drop size distributions. • These structures have implications for the A coefficient in Z=ARb relationships, which is how rain rate is estimated based on TRMM PR observations. • We will conclude by discussing how A derived from polarimetric radar compares to that from the PR algorithm. This comparison will be done using both the TRMM V6 and V7 datasets.
Kdp proportional to mass content and mass-weighted oblateness ratio Rainfall microphysics seen through combination of polarimetric variables KDP is a measure of the difference in wave propagation between H and V polarizations; sensitive to non-spherical particles Mass weighted….. b 50 Rain Z a 0.5 deg elevation angle 40 Reflectivity 30 Based on computations of Z and Kdp from DSD assumptions Oklahoma Differential Reflectivity 0 4 6 2 Kdp deg/km Difference in H,V phase in degrees
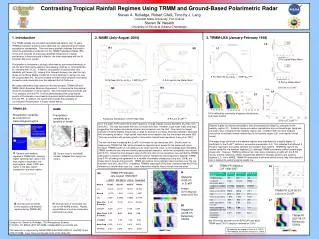
Application of polarimetric data…… Gorgucci et al. (2006, JTECH) showed that a parameter space formed by Kdp / Z vs. Zdr was useful for characterizing precipitation physics. Figure on the right shows results of scattering simulations for various Gamma DSD’s with mean diameters (Dm) ranging from 1.5 to 3.5 mm. Variations in Dm are evident as well-defined curving paths in Kdp/Z vs. Zdr space. This technique can also be used to distinguish warm rain-coalescence situations (high freezing level and active drop coalescence processes, smaller drop sizes) from rain derived from the melting of graupel and hail (larger drop sizes), as distinguished by Kdp/ Z; Zdr pairs. For a given rainfall regime, behavior of Kdp/Z vs. Zdr represents precipitation physics. Dm, mm Smaller drops, large liquid water contents Modest Z; high Kdp Large drops from melting ice Large Z
An illustrative example; contrasting the FNL flood case with a nearby bow echo storm… NLDN lightning for 5 hour period Heavy rain, little lightning FNL storm BEC storm 10 inches of rain in a 5 hour period Lightning with bow echo storm
Ft. Collins flood example; tropical like heavy rain event. Z=139R1.47 Nearby strong convective storm; Z=300R1.4 Z=139R1.47 High values of KDP/Z indicate large water contents with low Z; small ZDR, small drops Z=300R1.4 Larger ZDR values indicating melting ice particles Normalized density of points expressed as a percentage Yellow 70% Red 50% Blue 30% All points > 30 dBZ used
Flood (tropical like) event distinguished from bow echo by reduced Z and Zdr. Kdp/Z shifted to higher values for FNL (flood) case. Implies large LWC consisting of relatively small drops. Polarimetric variables consistent with Z-R forms for these events Small drops, high LWC, small A (FLOOD) Large drops, large A (BOW ECHO)
Shift to the tropics….. TRMM LBA, Jan-Feb 1999 NCAR S-pol radar deployed for TRMM-LBA Documented east-west regime with 7-10 day variability (Petersen and Rutledge, 2002)
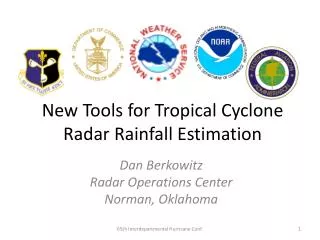
24 Feb 1999 WEST case. Lower CAPE, monsoon-like regime. 26 Jan 1999 EAST case. Stronger convection, higher CAPE. Subtle differences between East and West WEST EAST
WEST EAST LARGER ZDR VALUES IN EAST CASE COMPARED TO WEST. INDICATIVE OF LARGER DROPS (MELTING ICE) CONSISTENT WITH HIGHER CAPE/STRONGER CONVECTION IN EAST PHASE. IN WEST PHASE, LARGER Kdp/Z INDICATING SUBSTANTIAL LWC CONTAINED BY SMALL DROPS.
Following Bringi et al. 2004, J. Atmos. Ocean Technol., the A coefficient in Z=ARb is calculated via the so-called pole-tune method where a Gamma distribution is assumed Here A is a function of Z, D0 and μ. Bringi et al. argue that A derived in this manner continuously tracks the variability in DSD. “A” coefficients derived from the TRMM-LBA dataset using the NCAR S-pol radar. DSD’S ASSUME BROAD RANGE OF VALUES WITHIN EACH REGIME. KDP/LIN Z ZDR
N-Pol in MC3E sporting its new center-fed parabolic antenna and other upgrades Midlatitude Continental Convective Clouds Experiment May-June 2011 Observations from MC3E…..
Kdp DZ 25 April 2011: Multiple Convective Cores HID Zdr VR Rhohv
Kdp DZ 24 May 2011 Severe storm Zdr and Kdp column VR Zdr - 70+ dBZ up to 10 km - Large (+5 º/km) Kdp at the surface - Signature of large hail (in RH and ZDR) - Strong tilted updraft and divergence aloft - Data of high quality at significant ranges Rhohv HID
Warm rain Colorado events for comparison; Warm rain vs. melting hail examples Ice based N-Pol in Oklahoma, MC3E Results consistent with active coalescence growth and ice-based precipitation. Resulting from higher moisture contents, higher freezing level, collisional breakup, etc. N-POL N-POL
Rainfall: NASA GPM GV Measurement Infrastructure for IFloods • NASA IFLOODS DEPLOYMENT INSTRUMENTATION • Radars: Rain mapping, 4-D precip structure, DSD, rates • NPOL S-band transportable, scanning dual-pol radar • D3R radar: Dual-frequency (KA-KU), dual-polarimetric, Doppler radar. • 3 Metek Micro Rain Radars (K-band), vertically pointing (one on order) • Point-Network Disdrometer/Gauges: Precip character/reference • 5 2D Video Disdrometers • 16-20 Parsivel-2 Disdrometer with MetOne 12” TB Rain Gauge • 25 dual-gauge Met One TB rain gauges with soil T/Q Dual-Gauge Net Precipitation Video Imager (PVI) JW
May 2, 2013 – Cold, light rain [70 km] TRMM-LBA West regime Note: Axis change
May 26, 2013 – Convection Very similar to MC3E case
Squall line example from IFLOODS Large drops from melting graupel and small hail
Trailing stratiform region from same squall line Smaller drops from melting of aggregates
IMPLICATIONS FOR TRMM rain mapping The precipitation physics revealed by these polarimetric data have a direct bearing on Z-R based rain estimation and Z based attenuation correction Shift to upper left implies smaller “A” coefficient in Z=ARb and more rain for a given Z. Shift to lower right implies larger “A” coefficient in Z=ARb and less rain for a given Z. Have seen clear examples of these distinctive shifts…….which are due to microphysical variations in the production of rainfall Towards small A values Towards large A values
Kind of the crux of the matter….. Comparison of A coefficient in Z=ARb between TRMM 2A25 and those derived from S-pol polarimetric radar Rain physics variability was not well captured in Version 6, reflected by the restricted range of A TRMM V6 underpredicted intense rain
Rainfall physics much better captured in TRMM V7! For both regimes TRMM derived A has a double peak, coalescence and melting ice. Consistent with the range of polarimetric radar derived A values. Reasons for the improvement Introduced NUBF correction, increase in high rain rates Addition of 0.5 dB to PIA; increase in heavy rain over land. Changes to α in the k=αZeβ specific attenuation calculation