Download
1 / 8
80 likes | 388 Views
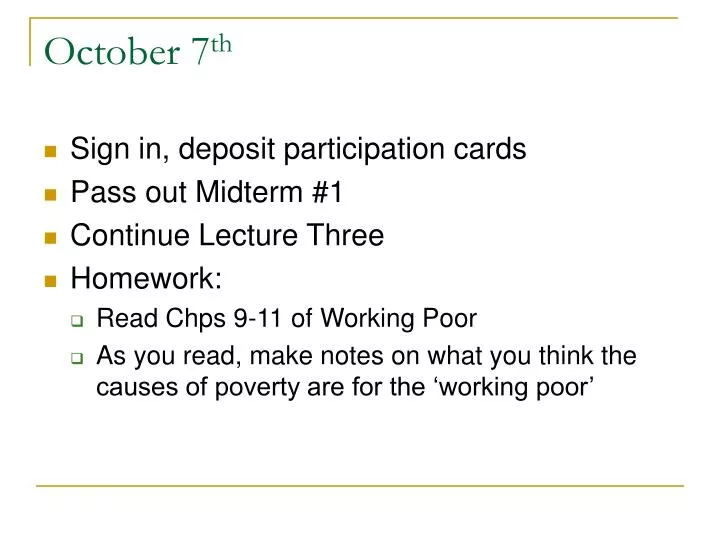
October 7 th Sign in, deposit participation cards Pass out Midterm #1 Continue Lecture Three Homework: Read Chps 9-11 of Working Poor As you read, make notes on what you think the causes of poverty are for the ‘working poor’ Poverty

E N D
October 7th • Sign in, deposit participation cards • Pass out Midterm #1 • Continue Lecture Three • Homework: • Read Chps 9-11 of Working Poor • As you read, make notes on what you think the causes of poverty are for the ‘working poor’
Poverty • Poverty: Official definition of poverty was developed in 1964 and is based on food consumption as 1/3 of household costs • Absolute – physical deprivation • Relative – deficiency relative to the population as a whole • What are the main expenditures for households today?
Who is most likely to be in Poverty? • 58% of Americans will live poverty for at least 1 year • 1 in 3 will experience extreme poverty for at least one year • 27% will experience poverty before age 30 • What creates this high risk for Americans? • Time – life stages, such as divorce and other unanticipated events • Safety Net – very few social services to help people through rough stages • and Labor Market – not enough good paying jobs
Feminization of Poverty • Women are disproportionately represented among the poor • More likely to be in low-pay service jobs • Women still make $0.76 for every man’s dollar • 42% of female-headed households are in poverty, compared to 9% of two-parent families • Children are more likely to live in poverty than adults – 35% of US poor are children
The Color of Poverty • Higher rates of poverty among non-whites • White- 8% • Black – 25% • Hispanic – 22% • American Indian – 25% • Average white family has a net worth 7 times that of the average Black family • This gap has grown since the 1960’s • The wealth gap accounts for many of the racial inequities • Racial disparities almost disappear when economic resources are equal
Working Poor or the Nearly Poor • Working Poor: workers in jobs at 27 weeks of the year that are less secure, low-paying, and deskilled • In 2005, 36.8% of the poor worked and 11.4% worked full-time • Over 5% of the population are ‘working poor,’ but majority are non-white, female, and immigrant
Why so many working poor? • Economic restructuring in the post-industrial society • High skill, high tech, high wage jobs versus • Low skill, low tech, low wage jobs • Increasing gap between the rich and poor • Ratio of CEO-worker pay in 2005 was 262 to 1 (in 1965 it was 24 to 1) • Welfare to work (1996) pushed many poor (primarily women) into low paying, dead-end jobs