Download
1 / 35
370 likes | 482 Views
Web Usage Mining (Part Two). Analysis Techniques of Discovered Patterns Gao kun. Figure 1: A General Architecture for Web Usage Mining. Figure 2. Sample web server log. " How are people using the site?", "Which pages are being accessed most frequently?"

E N D
Web Usage Mining(Part Two) Analysis Techniques of Discovered Patterns Gao kun
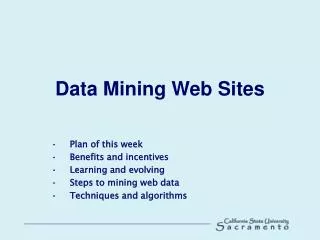
"How are people using the site?", "Which pages are being accessed most frequently?" The end products of such analysis might include 1) the frequencyof visits per document, 2) most recent visit per document, 3) who is visiting which documents, 4) frequency of use of each hyperlink, and 5) most recent use of each hyperlink
The most common form of pattern analysis consists of • a knowledge query mechanism such as • SQL • OLAP operations. • Visualization techniques
According to Srivastava & Cooley’s definition, we divide the prevailing analysis technique into four groups: a) Visualization Techniques b)OLAP Techniques c) Data & Knowledge Querying d) Usability Analysis
3.1 Visualization Techniques Visualization has been used very successfully in helping people understand various kinds of phenomena, both real and abstract. Hence it is a natural choice for understanding the behavior of Web users.
Pitkow developed C++ visualization tool (running on SunOS 4.1.3 and X) called WebViz for visualizing WWW access patterns.
Web-Path Paradigm • Recency (e.g., Was this page • touched recently?) • Frequency(e.g., How many times • has this link been used?),
3.2 OLAP Techniques (On-Line Analytical Processing) Some of the key characteristics of strategic analysis include 1) Very large data volume, 2) Explicit support for the temporal dimension, 3) Support for various kinds of information aggregation, and 4) Long-range analysis, where overall trends are more important than details of individual data items.
Two popular models for the OLAP servers for data warehouses: Relational OLAP Multidimensional OLAP.
The heart of OLAP or multidimensional data analysis application is the ability to simultaneously aggregate across many sets of dimensions. Users typically view the data as multidimensional data cubes. Each cell of the data cube is a view consisting of an aggregation of interest the CUBE operator is the N-dimensional generalization of the group-by operator. It computes group-bys corresponding to all possible combinations of a list of attributes
Example, in a retail application, one might have a table Transactions with attributes Product (P), Date (D), Customer(C) and Sales (S). The collection of aggregate queries can be conveniently expressed using the cube-operator as follows: SELECT P, D, C, SUM (S) FROM Transactions CUBE-BY P, D, C The query will result in the computation of 23=8 group-bys: PDC, PD, PC, DE, D, C, P and all, where all denotes the empty group-by.
The cube operator generalizes and unifies several common and popular concepts: Aggregates; Group by; Histograms; Roll-ups and drill-downs and; Cross tabs.
Example: Find out how many new messages were created on each day of the week over a whole semester for a particular fieldsite. we chose a particular level (i.e. drilldown in the same dimension)(“add a message”), and choose a particular value of interest on the fieldsite dimension, we then projected the intersect of both dimensions on the time dimension to locate the cells we wanted. Figure 8 shows the result. Using OLAP technique, such result can be generated interactively using the data cube structure.
3.3 Data & Knowledge Querying One of the reasons attributed to the great success of relational database technology has been the existence of a high-level, declarative, query language, which allows an application to express what conditions must be satisfied by the data it needs, rather than having to specify how to get the required data
Given the large number of patterns that may be mined, there appears to be a definite need for a mechanism to specify the focus of the analysis. Such focus may be provided in at least two ways. First, constraints may be placed on the database (perhaps in a declarative language) to restrict the portion of the database to be mined for. Second, querying may be performed on the knowledge that has been extracted by the mining process, in which case a language for querying knowledge rather than data is needed. (A SQL-like querying mechanism has been proposed for the WUM system).
The WUM (Web Utilization Miner) system is based on an ‘‘aggregated materialized view of the Web log’’ WUM's mining language, MINT: SQL-like syntax, but the queries are applied to groups of sequences.
Berendt and Spiliopoulou[4] applied the miner WUM on SchulWeb site. The results discovered in web usage analysis with WUM have implications for the evaluation of the SchulWeb interface, and can serve to recommend changes to the interface. They draw on the values in Tables 3 and 4 and their interpretation. They also draw on observations of patterns, which were too rare to be included in the statistical analysis.
On the above experience, WUM give the • answers to the questions like: • What could be a reason for the popularity of • this property? • What could be a reason for the sub-optimality • of these searches, reflected by search • refinements, long browsing and new searches? • ect. …
3.4 Usability Analysis Human-computer interactions (HCI) developing a computational science of usability. The principal goal of this effort is develop a systematic approach to usability studies by adapting the rigorous experimental method of a computational science
The activities constitute simulation-based computational science could be summarized as three steps: First, Computer modeling; Second, Computer simulation; Finally,Computer visualization
Simulation for studying HCI is a current area of research. We can imagine using simulation to create simulated log file analyses for depicting predicted user behavior, which might then be compared to log files gathered from actual users.
Figure 11. From the original news webpage to the modified one.
Conclusion: In this paper we give a definition of Web usage mining, and we provided a detailed survey of the efforts in this area. We provided a general architecture of a system to do Web usage mining, and identified some of the issues and problems in this area that may require further research and development
Conclusion: Know the customer! Build the brand! Know who is buying what! We should remember information is as an “experience good” A wealth of information creates a poverty of attention
Conclusion: Positive feedback makes large networks get larger Network effects lead to demand side economies of scale and positive (Network externalities)
Conclusion: Web log files contain much useful information about user behavior. Obtaining a using such customer information is essential to maximizing the value of our business.