Download
1 / 1
10 likes | 68 Views
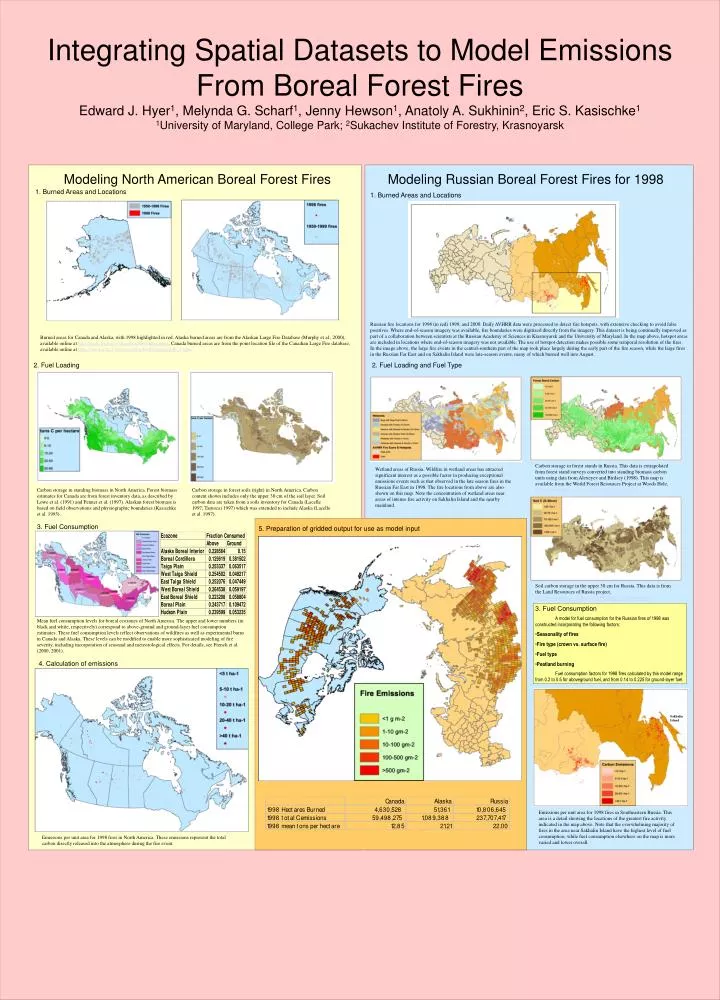
Integrating Spatial Datasets to Model Emissions From Boreal Forest Fires Edward J. Hyer 1 , Melynda G. Scharf 1 , Jenny Hewson 1 , Anatoly A. Sukhinin 2 , Eric S. Kasischke 1 1 University of Maryland, College Park; 2 Sukachev Institute of Forestry, Krasnoyarsk.

E N D
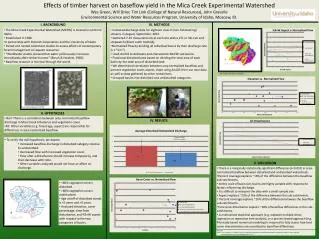
Integrating Spatial Datasets to Model Emissions From Boreal Forest FiresEdward J. Hyer1, Melynda G. Scharf1, Jenny Hewson1, Anatoly A. Sukhinin2, Eric S. Kasischke11University of Maryland, College Park; 2Sukachev Institute of Forestry, Krasnoyarsk Modeling North American Boreal Forest Fires Modeling Russian Boreal Forest Fires for 1998 1. Burned Areas and Locations 1. Burned Areas and Locations Russian fire locations for 1998 (in red) 1999, and 2000. Daily AVHRR data were processed to detect fire hotspots, with extensive checking to avoid false positives. Where end-of-season imagery was available, fire boundaries were digitized directly from the imagery. This dataset is being continually improved as part of a collaboration between scientists at the Russian Academy of Sciences in Krasnoyarsk and the University of Maryland. In the map above, hotspot areas are included in locations where end-of-season imagery was not available. The use of hotspot detection makes possible some temporal resolution of the fires. In the image above, the large fire events in the central-southern part of the map took place largely during the early part of the fire season, while the large fires in the Russian Far East and on Sakhalin Island were late-season events, many of which burned well into August. Burned areas for Canada and Alaska, with 1998 highlighted in red. Alaska burned areas are from the Alaskan Large Fire Database (Murphy et al., 2000), available online at http://agdc.usgs.gov/data/blm/fire/index.html. Canada burned areas are from the point location file of the Canadian Large Fire database, available online at http://www.nofc.forestry.ca/fire/frn/English/clfdb_e.htm. 2. Fuel Loading 2. Fuel Loading and Fuel Type Carbon storage in forest stands in Russia. This data is extrapolated from forest stand surveys converted into standing biomass carbon units using data from Alexeyev and Birdsey (1998). This map is available from the World Forest Resources Project at Woods Hole, http://www.whrc.org/science/globfor/globfor.htm . Wetland areas of Russia. Wildfire in wetland areas has attracted significant interest as a possible factor in producing exceptional emissions events such as that observed in the late season fires in the Russian Far East in 1998. The fire locations from above are also shown on this map. Note the concentration of wetland areas near areas of intense fire activity on Sakhalin Island and the nearby mainland. Carbon storage in standing biomass in North America. Forest biomass estimates for Canada are from forest inventory data, as described by Lowe et al. (1991) and Penner et al. (1997). Alaskan forest biomass is based on field observations and physiographic boundaries (Kasischke et al. 1995). Carbon storage in forest soils (right) in North America. Carbon content shown includes only the upper 30 cm of the soil layer. Soil carbon data are taken from a soils inventory for Canada (Lacelle 1997; Tarnocai 1997) which was extended to include Alaska (Lacelle et al. 1997). Canada Alaska Russia 1998 Hectares Burned 4,630,528.00 51,361.00 10,806,645.21 1998 total C emissions 59498275 1089388 237707416.9 1998 mean tons per hectare 12.84913405 21.21041257 21.99641168 3. Fuel Consumption 5. Preparation of gridded output for use as model input Soil carbon storage in the upper 30 cm for Russia. This data is from the Land Resources of Russia project, http://www.iiasa.ac.at/Research/FOR/russia_cd/guide.htm • 3. Fuel Consumption • A model for fuel consumption for the Russian fires of 1998 was constructed incorporating the following factors: • Seasonality of fires • Fire type (crown vs. surface fire) • Fuel type • Peatland burning • Fuel consumption factors for 1998 fires calculated by this model range from 0.2 to 0.5 for aboveground fuel, and from 0.14 to 0.225 for ground-layer fuel. Mean fuel consumption levels for boreal ecozones of North America. The upper and lower numbers (in black and white, respectively) correspond to above-ground and ground-layer fuel consumption estimates. These fuel consumption levels reflect observations of wildfires as well as experimental burns in Canada and Alaska. These levels can be modified to enable more sophisticated modeling of fire severity, including incorporation of seasonal and meteorological effects. For details, see French et al. (2000, 2001). 4. Calculation of emissions Sakhalin Island Emissions per unit area for 1998 fires in Southeastern Russia. This area is a detail showing the locations of the greatest fire activity indicated in the map above. Note that the overwhelming majority of fires in the area near Sakhalin Island have the highest level of fuel consumption, while fuel consumption elsewhere on the map is more varied and lower overall. Emissions per unit area for 1998 fires in North America. These emissions represent the total carbon directly released into the atmosphere during the fire event.