Download
1 / 15
150 likes | 164 Views
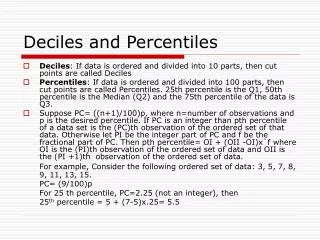
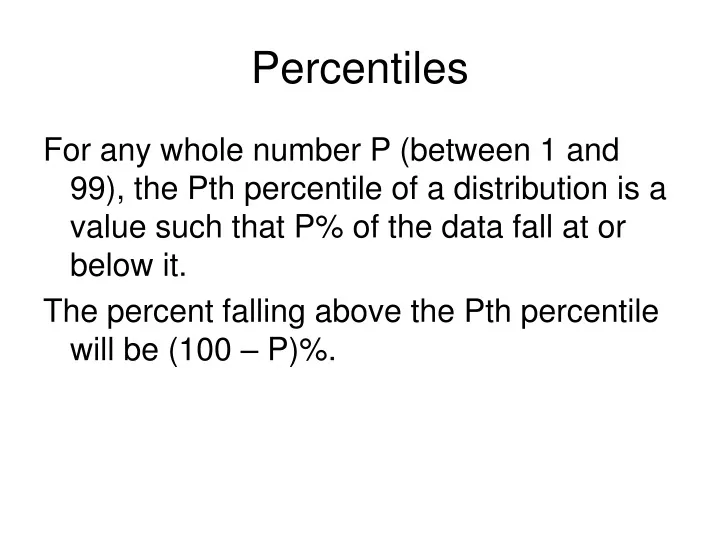
Percentiles. For any whole number P (between 1 and 99), the Pth percentile of a distribution is a value such that P% of the data fall at or below it. The percent falling above the Pth percentile will be (100 – P)%. P 40. Lowest value. Highest value. Percentiles. 40% of data. 60% of data.

E N D
Percentiles For any whole number P (between 1 and 99), the Pth percentile of a distribution is a value such that P% of the data fall at or below it. The percent falling above the Pth percentile will be (100 – P)%.
P 40 Lowest value Highest value Percentiles 40% of data 60% of data
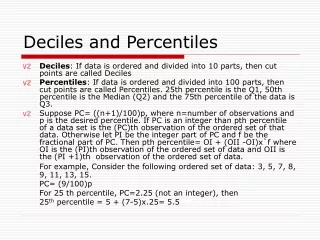
Quartiles • Percentiles that divide the data into fourths • Q1 = 25th percentile • Q2 = the median • Q3 = 75th percentile
Quartiles Median = Q2 Q1 Q3 Lowest value Highest value Inter-quartile range = IQR = Q3 — Q1
Computing Quartiles • Order the data from smallest to largest. • Find the median, the second quartile. • Find the median of the data falling below Q2. This is the first quartile. • Find the median of the data falling above Q2. This is the third quartile.
Find the quartiles: 12 15 16 16 17 18 22 22 23 24 25 30 32 33 33 34 41 45 51 The data has been ordered. The median is 24.
Find the quartiles: 12 15 16 16 17 18 22 22 23 24 25 30 32 33 33 34 41 45 51 The data has been ordered. The median is 24.
Find the quartiles: 12 15 16 16 17 18 22 22 23 24 25 30 32 33 33 34 41 45 51 For the data below the median, the median is 17. 17 is the first quartile.
Find the quartiles: 12 15 16 16 17 18 22 22 23 24 25 30 32 33 33 34 41 45 51 For the data above the median, the median is 33. 33 is the third quartile.
Find the interquartile range: 12 15 16 16 17 18 22 22 23 24 25 30 32 33 33 34 41 45 51 IQR = Q3 – Q1 = 33 – 17 = 16
Five-Number Summary of Data • Lowest value • First quartile • Median • Third quartile • Highest value
Box-and-Whisker Plot a graphical presentation of the five-number summary of data
Making a Box-and-Whisker Plot • Draw a vertical scale including the lowest and highest values. • To the right of the scale, draw a box from Q1 to Q3. • Draw a solid line through the box at the median. • Draw lines (whiskers) from Q1 to the lowest and from Q3 to the highest values.
Construct a Box-and-Whisker Plot: 12 15 16 16 17 18 22 22 23 24 25 30 32 33 33 34 41 45 51 Lowest = 12 Q1 = 17 median = 24 Q3 = 33 Highest = 51
60 - 55 - 50 - 45 - 40 - 35 - 30 - 25 - 20 - 15 - 10 - Box-and-Whisker Plot Lowest = 12 Q1 = 17 median = 24 Q3 = 33 Highest = 51