Download
1 / 67
670 likes | 675 Views
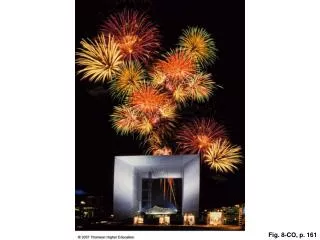
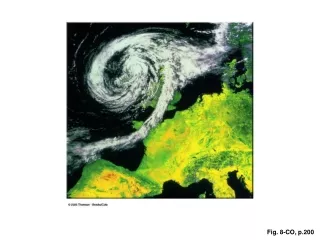
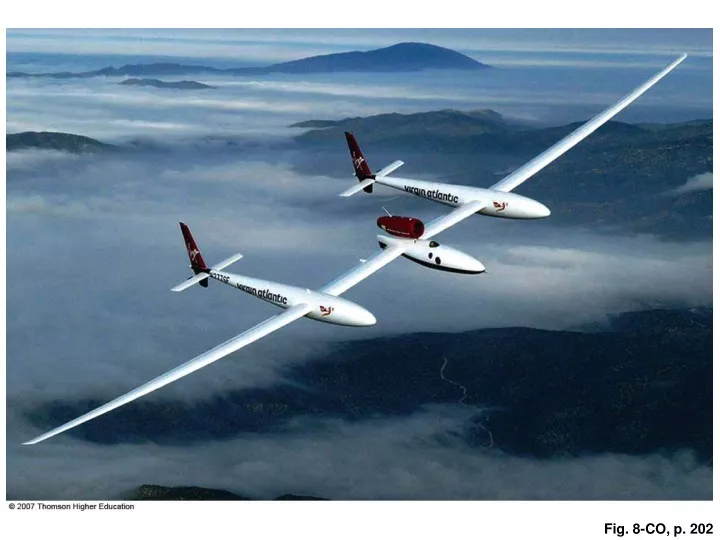
Fig. 8-CO, p. 202. Fig. 8-1, p. 203. Nitrogen (N 2 ). Oxygen (O 2 ). Argon (Ar) Carbon dioxide (CO 2 ) Neon, Helium, Methane, and other elements and compounds. Fig. 8-1, p. 203. Fig. 8-2a, p. 204. 2,000 m. 10°C. Expands and cools. Compresses and warms. 1,000 m. 20°C. 30°C.

E N D
Nitrogen (N2) Oxygen (O2) Argon (Ar) Carbon dioxide (CO2) Neon, Helium, Methane, and other elements and compounds Fig. 8-1, p. 203
2,000 m 10°C Expands and cools Compresses and warms 1,000 m 20°C 30°C Air parcel 0 m Fig. 8-2a, p. 204
Incoming short-wave solar radiation (light) at top of atmosphere: 7 million calories per square meter per day, averaged for the Earth as a whole 100% 100% Light (short-wave radiation), 30% Infrared (long-wave) radiation, 70% Outgoing radiation = 100% + Space 26% 100% 6% 20% 4% 6% 38% Atmosphere Back-scattered by air Emission by clouds Net emission by water vapor, CO2 16% Absorbed by water vapor, dust, CO2 Reflected by clouds Absorption by water vapor, CO2 15% Absorbed by clouds Absorbed by water and land 3% Net surface emission of long-wave radiation Latent heat Reflected by water and land surface Sensible heat 51% 21% 7% 23% Fig. 8-3, p. 205
Light bounces off Up 1 m2 Solar beam Sun is low in the sky 1 m2 Solar beam Sun is overhead Up Light is absorbed Equator Fig. 8-4, p. 206
Balance Balance Surplus Deficit Deficit Heat transfer Heat transfer Radiant energy in one year 90 60 30 0 30 60 90 °North °South Latitude Average annual solar radiation absorbed Average annual infrared radiation emitted Fig. 8-5a, p. 206
North Pole Net heat loss 38°N Net heat gain Net energy transport Equator Net heat gain 38°S Net heat loss South Pole Fig. 8-5b, p. 206
Winter (Northern Hemisphere tilts away from sun) 23½° Spring (sun aims directly at equator) To Polaris Summer (Northern Hemisphere tilts toward sun) Fall (sun aims directly at equator) Fig. 8-6, p. 207
Winter (Northern Hemisphere tilts away from sun) 23½° To Polaris Spring (sun aims directly at equator) Summer (Northern Hemisphere tilts toward sun) Fall (sun aims directly at equator) Stepped Art Fig. 8-6, p. 207
Cold window (closed) Warm air rising Hot radiator Cool air falling Fig. 8-7, p. 208
North Pole Descending cold air Rising warm air Hot Equator Cool Descending cold air Fig. 8-8, p. 208
North Pole Earth “skinnier” here Buffalo disk Buffalo Path of Buffalo in one day Quito disk Equator Earth “fat” here Quito Path of Quito in one day 79°W South Pole Fig. 8-9, p. 209
Quito moves at 1,668 km/hr (1,036 mi/hr). Note: Quito’s longer distance through space in one hour is still 15°. Buffalo moves at 1,260 km/hr (783 mi/hr). Note: Buffalo’s shorter distance through space in one hour is still 15°. 15° (Earth rotates east) North Pole Buffalo disk Equator Quito disk Fig. 8-11, p. 210
Buffalo 1,260 km/hr (783 mi/hr) east Lands off course! Cannonball 1 Cannonball 2 Quito 1,668 km/hr (1,036 mi/hr) east Misses! −79°W Fig. 8-12, p. 210
Polar cell Jet stream, flows west to east Mid-latitude cell (Ferrel cell) Westerlies 60° Subtropical high-pressure belt 30° Cool air falls Tropical cell (Hadley cell) Northeasterly trades Warm air rises Equatorial trough - low-pressure belt (Doldrums, ITCZ) Equator Southeasterly trades Tropical cell (Hadley cell) Cool air falls 30° Subtropical high-pressure belt Mid-latitude cell (Ferrel cell) 60° Westerlies Jet stream, flows west to east Polar cell Fig. 8-13, p. 211
July ? July Geographical equator January Geographical equator January Fig. 8-14, p. 213
Northeast monsoon Geographical equator Northwest monsoon ITCZ January ITCZ Geographical equator Southwest monsoon African southwest monsoon Southeast monsoon July Fig. 8-16a/b, p. 215
Cherrapunji L Bay of Bengal South China Sea Wet, unstable air Fig. 8-16c, p. 215
Warm air ascends Cool air descends Onshore flow Warmer land Cooler sea Fig. 8-17a, p. 216
Cool air descends Warm air ascends Offshore flow Cooler land Warmer sea Fig. 8-17b, p. 216
North Cold air pressure increases Atmospheric Cold air Low Low Warm front pressure increases Front A Atmospheric Warm air Cold front Warm air South Stage 1 Stage 2 Stage 3 Fig. 8-19a, p. 218
26000 ft Winds aloft Thunderstorms Widespread precipitation 0°C (32°F) Warm air 0 ft 0°C (32°F) 11°C (52°F) Warm front Cold front B Cold air A L Cold air receding 4°C (39°F) 0°C (32°F) -6°C (22°F) 9°C (48°F) 50 km 600 km Fig. 8-19b, p. 218