Download
1 / 70
710 likes | 986 Views
How Many People Can the Earth Support?. We do not know how long we can continue increasing the earth’s carrying capacity for humans without seriously degrading the life-support system for humans and many other species. . Environmental science.

E N D
How Many People Can the Earth Support? We do not know how long we can continue increasing the earth’s carrying capacity for humans without seriously degrading the life-support system for humans and many other species.
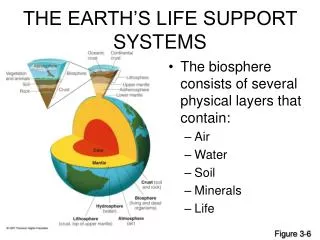
Environmental science is the study of how the natural world works, and what is happening to it as the human population expands. It includes all of the natural sciences and sometimes economics and a few other social sciences. • Major topics can be boiled down to: • Human population • Energy & all implications of its use including air pollution • Resources-biological, water, mineral
What is environmental science? Knowing where your water/food/energy come from and where your waste goes
The single driving mechanism for all the environmental problems we face in the world today may be exponential growth.
Key Concepts • Humans are subject to natural laws and ecological processes such as limiting factors. • Significant differences in developed vs. developing worlds • Unlimited use of natural resources is unsustainable • There are a number of tools to understand populations project future outcomes
There are more people living on Earth today than ever before in human history. Both the number of people and the amount of overall consumption exert an impact on the environment. Wednesday Jan26
Today 6.6B www.prb.org
What Factors Influence the Size of the Human Population? Population size increases because of births and immigration and decreases through deaths and emigration. The average number of children born to women in a population (total fertility rate) is the key factor that determines population size.
Population Size • Natality • Number of individuals added through reproduction • Crude Birth Rate - Births per 1000 • Total Fertility Rate – Average number of children born alive per woman in her lifetime • Mortality • Number of individuals removed through death • Crude Death Rate Deaths per 1000
Calculating Population Change, = (Births + Immigration) – ( Deaths + Emmigration)
Demographic TransitionCalculating the % increase or decrease of a population (CBR – CDR)/10 = Rate of increase or decrease in population per 1,000 per year Number of births or deaths/1000 so countries can be compared. Crude because no consideration of who is old or young
Calculating Doubling Times 70/Rate of Increase = Doubling Time The world rate of population increase is 1%. How long would it take to double the population? 70 years
Calculating % increase (Fertility Rates) and Doubling Times: Practice Calculate the Rates of increase and doubling times
Calculating % increase (Fertility Rates) and Doubling Times: Practice
End of WWII Depression Demographic Transition Baby Boom…………….. Echo Baby Boom…………
Age Structure Diagrams Positive Growth Zero Growth Negative Growth (ZPG) Pyramid Shape Vertical Edges Inverted Pyramid
Human Population Growth Continues but It Is Unevenly Distributed Population growth in developing countries is increasing 15 times faster than developed countries By 2050, 97% of growth will be in developing countries Should the optimum sustainable population be based on cultural carrying capacity?
Major concers that growing populations cause increased environmental stresses? Infectious diseases Biodiversity losses Water shortages Traffic congestion Pollution of the seas Climate change Population Capacity 3 BBC Water Use
What is Earth’s Population Capacity • Population Capacity 2 • Population Capacity 3 Water Use • Population Capacity 4 Competition for scarce resources • Population Capacity 5 today’s population • Population Capacity 6 Future Efforts
Women Having Fewer Babies but Not Few Enough to Stabilize the World’s Population Fertility rate Replacement-level fertility rate Total fertility rate (TFR)
Several Factors Affect Death Rates (1) Life expectancy & Infant mortality rate Why are people living longer and fewer infants dying? Increased food supply and distribution Better nutrition Medical advances Improved sanitation
Several Factors Affect Death Rates (2) U.S. infant mortality rate high due to Inadequate health care for poor women during pregnancy and their infants Drug addiction among pregnant women High birth rate among teenagers
Migration Affects an Area’s Population Size Economic improvement Religious freedom Political freedom Wars Environmental refugees
No one knows if the population on Earth will double again. Although the number of additional people on Earth continues to increase each year, the rate at which the population is growing each year, the growth rate, is slowing.
Infant Mortality:number of deaths by age 1 per 1000 live births in the populationUSA Average 6.6Sweden 2.4France 3.6Afghanistan 166
Infant Mortality (all values from 2005)USA Average 6.6 African-Americans 13.6 Native Americans 8.9Washington, D.C. 11.4Mississippi 10.5Louisiana 9.8Utah 4.8New Hampshire 3.8Singapore 2.3Sweden 3.1Bolivia 54Burundi 106Angola 188
Age Structure • The age structure of a population is usually shown graphically • The population is usually divided up into prereproductives, reproductives and postreproductives • The age structure of a population dictates whether is will grow, shrink, or stay the same size
Age Structure Diagrams Positive Growth Zero Growth Negative Growth (ZPG) Pyramid Shape Vertical Edges Inverted Pyramid
Disparities • Developed countries • 16% of the world’s population • Control 81% of the world’s wealth • Low-income developing countries • 41% of the world’s population • Control 3.4% of the world’s gross national income • Difference in per capita income: 62 to 1!
Different Populations, Different Problems • Human pressure on the environment caused by three factors • Population size • Affluence • Technology
Ecological Footprints by World Region • The average American places at least 20 times the demand on Earth’s resources as does an average person in Bangladesh Fig. 5.7 here
Global Conditions for a Sustainable Population • Lower fertility rates (stabilize population) • Consumption must decrease • Protect the environment (stewardly action must increase)
Consequences of Population Growth and Affluence • The developing countries • Affluence
Developing or Developed Nations? • High fertility rates • High consumptive lifestyles: use 80% of world’s wealth • Intense poverty • Eat high on the food chain
Developing or Developed Nations? • Long doubling times • High environmental degradation • Twenty percent of the world’s population
Basic Human Needs • Drinkable Water • Edible Food • Safe Housing • Health Care • An Education • A Job
Consequences of Exploding Populations in the Developing World
Consequences of Exploding Populations deforestation resource depletion loss of agricultural land biodiversity disease pest resistance population migration irrigation wetlands MORE More Population Causes LESS