1 / 1

A. C. B. D.

lovey
Download Presentation

An Image/Link below is provided (as is) to download presentation Download Policy: Content on the Website is provided to you AS IS for your information and personal use and may not be sold / licensed / shared on other websites without getting consent from its author. Content is provided to you AS IS for your information and personal use only. Download presentation by click this link. While downloading, if for some reason you are not able to download a presentation, the publisher may have deleted the file from their server. During download, if you can't get a presentation, the file might be deleted by the publisher.

E N D

Presentation Transcript


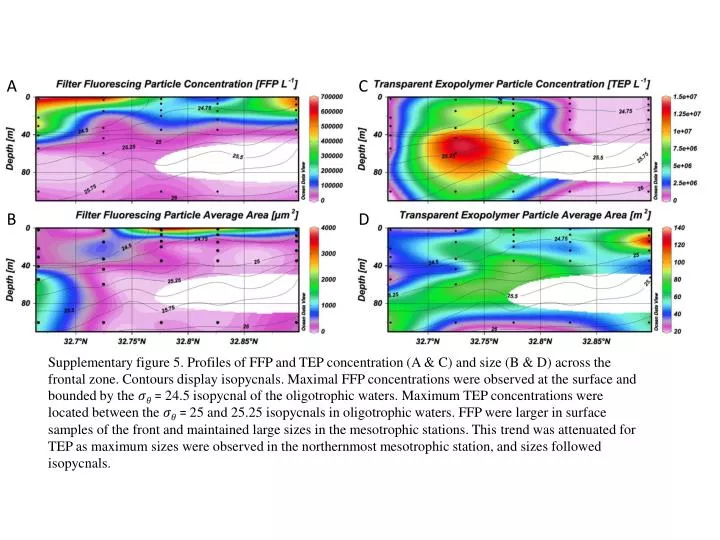
  1. A C B D Supplementary figure 5. Profiles of FFP and TEP concentration (A & C) and size (B & D) across the frontal zone. Contours display isopycnals. Maximal FFP concentrations were observed at the surface and bounded by the 𝜎𝜃 = 24.5 isopycnal of the oligotrophic waters. Maximum TEP concentrations were located between the 𝜎𝜃= 25 and 25.25 isopycnals in oligotrophic waters. FFP were larger in surface samples of the front and maintained large sizes in the mesotrophic stations. This trend was attenuated for TEP as maximum sizes were observed in the northernmost mesotrophic station, and sizes followed isopycnals.

More Related