Download
1 / 64
730 likes | 949 Views
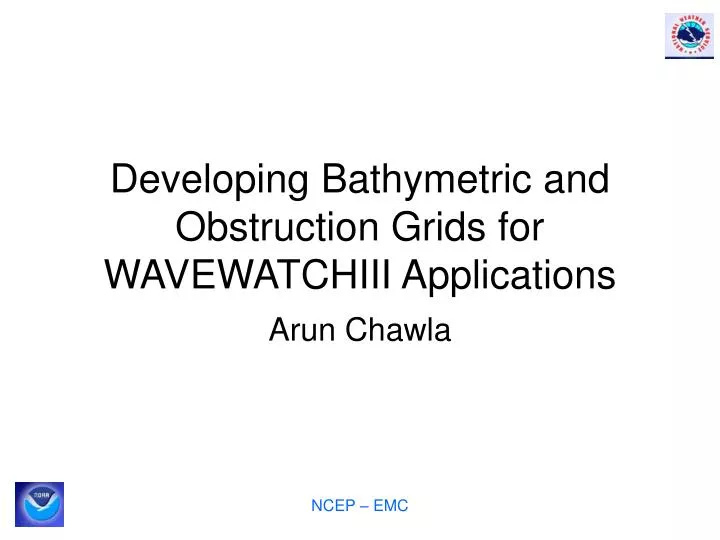
Developing Bathymetric and Obstruction Grids for WAVEWATCHIII Applications. Arun Chawla. Motivation. Wave Watch III requires two input grids Bathymetric grid with appropriate land/sea mask Obstruction grid to account for energy decay due to sub-grid blocking

E N D
Developing Bathymetric and Obstruction Grids for WAVEWATCHIII Applications Arun Chawla NCEP – EMC
Motivation • Wave Watch III requires two input grids • Bathymetric grid with appropriate land/sea mask • Obstruction grid to account for energy decay due to sub-grid blocking • Development of these grids can be a fairly arduous task • Our aim is to develop a set of algorithms that can automatically create accurate grids with minimal input from the user • We use MATLAB to develop the necessary tools NCEP – EMC
Obstruction grid – Proof of concept Tolman (2003) showed that sub-grid islands can be modeled in WAVEWATCHIII by physically reducing the energy fluxes between the cells 1D Spatial propagation in WAVEWATCHIII Density flux and transparencies at cell boundaries Spectral density Reduction of energy dependent upon the proportion of cell being obstructed Obstruction grid ranges from 0 (no obstruction) to 1 (full obstruction) Two obstruction grids (for the 2 directions of motion) used in WAVEWATCHIII NCEP – EMC
MODULES • Build a bathymetry grid from high resolution data • Create an appropriate land – sea mask to accurately depict coast lines • Mask out un-necessary water bodies • Build obstruction grids for blocking from unresolved islands NCEP – EMC
Reference Data • Two types of high resolution reference data available • A global high resolution bathymetry data set on a 2’grid • ETOPO2 from the National Geophysical Data Center • DBDB2 from the Naval Research Laboratory • A global shoreline database in the form of polygons (GSHHS - Global Self-consistent Hierarchical High-resolution Shoreline) • Algorithms will be designed to meld the high resolution bathymetry with the shoreline database to develop the optimum grids. NCEP – EMC
Why Shoreline Polygons? • There are 188,606 shoreline polygons (180,509 coastal) in the data base • Over 99 % of these have a cross sectional area < 6 km2 (cross sectional area of a 2’ grid square ~ 14 km2) • Convenient to treat land bodies as closed polygons • Precludes need for representation in high resolution grid • Trivial to compute extent of coastal bodies along the grid axes NCEP – EMC
Why Shoreline Polygons (contd.)? • Atolls are very well represented • Additional obstructions (e.g. breakwaters) easily added • Trivial to mask out selected bodies of water (e.g. Hudson Bay) or reefs (e.g. Great Barrier Reef) Atolls cover very little surface area but provide effective barriers to wave propagation NCEP – EMC
ETOPO2 or DBDB2 ? • Data should adequately represent the bathymetry between 500 m below MSL and 20 m above MSL • Islands and other shoreline features reasonably represented NCEP – EMC
ETOPO2 DBDB2 ETOPO2-DBDB2 Reference NCEP – EMC
ETOPO2 DBDB2 Penguin bank represented in ETOPO2 but absent in DBDB2 NCEP – EMC
ETOPO2 DBDB2 Pailolo channel represented in ETOPO2 but absent in DBDB2 NCEP – EMC
ETOPO2 DBDB2 NCEP – EMC ETOPO2-DBDB2 Reference
ETOPO2 DBDB2 Albatros Bank represented in ETOPO2 but absent in DBDB2 NCEP – EMC
ETOPO2 DBDB2 Cook Inlet entrance better represented in ETOPO2 NCEP – EMC
In general… • ETOPO2 represents the coastal bathymetry better • DBDB2 represents the coastline features better • Differences between ETOPO2 and DBDB2 seen in other parts of the world but not verified • DBDB2 includes high resolution bathymetry data in other regions of the world (not verified) • A blend of the two grids may be more appropriate in the future NCEP – EMC
Subroutines • A grid generation routine • Generates a grid from global 2’ ETOPO2 or DBDB2 bathymetry netcdf files • A boundary extraction routine • Extracts a subset of boundaries from a global set of polygon boundaries (GSHHS) • A land-mask routine • Blends the bathymetric data with the coastal boundaries to develop an accurate land-sea mask • A water body routine • Groups the wet cells into different water bodies (each having a unique id) • A sub-grid obstruction routine • Develops sub-grid obstruction matrices in x and y direction for wet cells NCEP – EMC
Flow Chart High resolution grid DBDB2/ETOPO2 GSSHS boundary polygons (5 resolution levels) Optional land mask polygons Grid generator Boundary extractor Boundary check Create mask bound lat depth lon Separate water bodies mask Create Wave Watch III files Generate obstruction grid Depth, obstruction and mask data Sx,Sy NCEP – EMC
Grid Generation Routine • Routine uses 2D averaging to interpolate the higher resolution (reference) grid at the lower resolution • Averaging carried out over all the reference “wet cells” that lie within a grid cell • If the proportion of reference wet cells is less than user specified cut-off (ranging between 0 and 1) then the grid cell is marked dry. • Averaging filters out higher spatial frequencies and prevents aliasing Reference grid cell Grid points Reference grid points Grid cell NCEP – EMC
Bathymetry cross sections along 3 transects in the Bahamas High resolution bathymetry Averaged bathymetry NCEP – EMC Sampling points Sub sampled bathymetry
0.4 0.1 0.7 0.9 NCEP – EMC
Boundary extraction routine • Uses the GSHHS (Global Self-consistent Hierarchical High-resolution Shoreline) polygon database. • High resolution data is available as mat files at 5 resolutions – full, high (0.2 km), intermediate (1 km), low (5 km), coarse (25 km) • Only accounts for land – sea boundaries (ignores lakes) • Properly splits boundaries that are intersecting grid domain boundary • Important to properly close the boundaries to determine land masks and sub grid obstructions NCEP – EMC
Improperly closed boundaries NCEP – EMC
Splitting a boundary properly NCEP – EMC
Full Resolution Global Boundary Global boundaries Grid domain Sub-set boundaries NCEP – EMC
Land-sea mask routine • A first order land mask (based on a depth cutoff) is determined • The land mask routine then • Checks all well cells near the boundaries • Switches wet cells to dry if a proportion of cell within the boundary > user specified cutoff (currently set at 0.5) • Land mask routine needed to • Account for land masses not present in base bathymetry grid • Resolve discrepancies between shoreline data base and base bathymetry shorelines • Account for additional polygons NCEP – EMC
To compute proportion of cell inside boundary • Equally spaced points spread throughout the cell • Determine number of points enclosed within boundary • Number of points inside boundary/Total number of points NCEP – EMC
Land-Sea Mask (Bahamas 15 min grid) Red – Wet Cell Blue – Dry Cell White – Wet cell switched to dry cell NCEP – EMC
Depth + Mask Depth (0.1) NCEP – EMC
Wet cell clean up routine • Cycle through all the wet cells and flag all connected cells with the same id • Independent water bodies have different ids • Function returns an id map that allows users to switch cells of a particular water body from wet to dry • Switching of cells can either be done inside the routine with a flag option, or outside by the user NCEP – EMC
Initialize all wet cells as unmarked • Starting from first unmarked cell with marker value at 1, mark all connected wet cells with the same marker • If more unmarked cells then increment marker by 1 and repeat step 2. • Keep repeating steps 3 and 2 till no longer unmarked wet cells • End result is a mask map with the wet cells grouped into independent water bodies NCEP – EMC
Obstruction grid – Proof of concept Tolman (2003) showed that sub-grid islands can be modeled in WAVEWATCHIII by physically reducing the energy fluxes between the cells 1D Spatial propagation in WAVEWATCHIII Density flux and transparencies at cell boundaries Spectral density Reduction of energy dependent upon the proportion of cell being obstructed Obstruction grid ranges from 0 (no obstruction) to 1 (full obstruction) Two obstruction grids (for the 2 directions of motion) used in WAVEWATCHIII NCEP – EMC
Building an obstruction grid • Boundary polygons ideal for building obstruction grids • Obstruction computed as proportion of cell length obstructed by boundary (ies) • Obstruction data for cells next to dry cells set to 0 (to avoid spurious energy decay) • Sx = obstruction along x = obstruction height/cell height • Sy = obstruction along y = obstruction width/cell width NCEP – EMC
Points to consider while building an obstruction grid (a) Boundaries crossing cells in the same path Option1: Account for obstruction path in neighboring cells Energy flux from B to C should be fully obstructed Option2: Move boundary segments from common boundary in neighboring cells to the same cell Using option 2 prevents over counting NCEP – EMC
Points to consider while building an Obstruction grid (contd.) (b) Multiple boundaries within a cell Ignore for Sy Ignore for Sx Obstruction should not be determined from the sum of all lengths but the net length NCEP – EMC
Points to consider while building an Obstruction grid (contd.) (c) Neighboring cell information Orientation of boundaries in neighboring cell can lead to greater obstruction than from using boundary information in individual cells only NCEP – EMC
Points to consider while building an Obstruction grid (contd.) (d) Discount overlapping boundaries from neighboring cells Non – zero Sx,Sy values for any particular cell should be computed if obstructions in the cell contribute to the obstruction process NCEP – EMC
Points to consider while building an Obstruction grid (contd.) (e) How do you account for neighboring cells ? Option1: Consider neighbors on both sides Cell B Sx values would include information from cell C Cell C Sx values would include information from cell B Wave propagation from left to right (or right to left) will lead to over attenuation NCEP – EMC
Points to consider while building an obstruction grid (contd.) (e) How do you account for neighboring cells (contd.)? Option2: Consider neighbors on one side alone Cell B Sx values would include information from cell C (neighbor to right ) Cell C Sx values would include information from cell B (neighbor to left) Use right neighbor for wave propagation from right to left Use left neighbor for wave propagation from left to right NCEP – EMC
Numerical Tests • Numerical tests conducted to validate the obstruction algorithm • Numerical tests conducted in 3 different regions • Caribbean Islands • Hawaii • French Polynesian Islands • Swell propagated in each region using grids at 5 different resolutions – 2’, 4’, 8’, 15’ and 30’ • For each grid resolution obstruction grids constructed using – no neighboring cells, neighboring cells from one side, neighboring cells from both sides • Constant swell conditions along the northern and eastern boundaries with • Monochromatic frequency component (Hs=4m,Tp=10s) • Propagating from the Northwest at 45o, with 20o directional spread NCEP – EMC
Test Case 1 – Caribbean NCEP – EMC
Grids for the Caribbean (land – sea masks) 4’ grid 2’ grid GSHHS 30’ grid 15’ grid 8’ grid NCEP – EMC
Swell propagation without obstruction grids (Normalized significant wave heights) 8’ grid 4’ grid 2’ grid 30’ grid 15’ grid NCEP – EMC
Swell propagation with obstruction grids (Normalized significant wave heights) 8’ grid 2’ grid 4’ grid 15’ grid 30’ grid NCEP – EMC
Swell Propagation in 2’ grid (normalized heights) (a) Without obstruction (b) With obstruction NCEP – EMC (c) b-a
Difference plots in the absence of obstruction Garden Sprinkler Effect (b) 2’ – 8’ (a) 2’ – 4’ NCEP – EMC (c) 2’ – 15’ (d) 2’ – 30’
Garden Sprinkler Effect 2’ grid 8’ grid 4’ grid 30’ grid 15’ grid NCEP – EMC
Headland and Channel Resolution 2’ grid 8’ grid 4’ grid 30’ grid 15’ grid NCEP – EMC