Download
1 / 7
70 likes | 199 Views
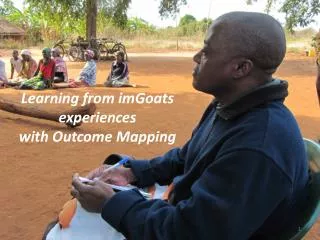
Learning from imGoats experiences with Outcome Mapping . Presented by Ann Braun at the imGoats Learning & Reflection Workshop, 2-6 July 2012, Udaipur, India. Design, Planning, Mgmt, Monitoring, Evaluation, Reporting and the Project/Programme Cycle. Completion/Transition. E. E. E.

E N D
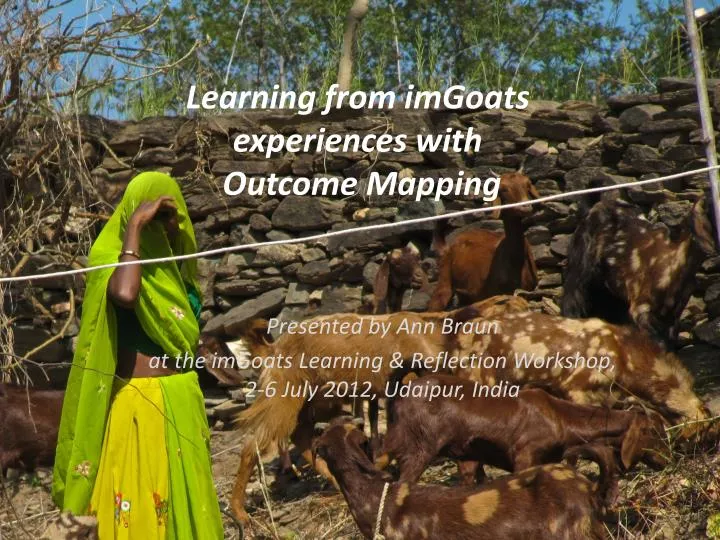
Learning from imGoats experiences with Outcome Mapping Presented by Ann Braun at the imGoats Learning & Reflection Workshop, 2-6 July 2012, Udaipur, India
Design, Planning, Mgmt, Monitoring, Evaluation, Reporting and the Project/Programme Cycle Completion/Transition E E E Implement Identify Implement Identify MP, MGMT, R Design & Plan Knowledge from research & evaluation Design | Plan Design Programme Plan ImplementationDesign & Plan M&E
Guidance: Morning Session Key Q: What went well & less well in our application of OM? Process: • Sit together in teams: India & Moz • Discuss the five KQs and prepare responses (30-40 mins) • What went well in your application of OM (data collection, management, analysis, use, etc.)? • What went less well? • What did you do to meet the problems/issues that arose? • What did you do to take advantage of any positive experiences with OM? • What have you learned about applying OM in imGoats? • Choose a representative from your team. Reps from each team will interview each other using the five KQs, and following up with probing questions. (60 mins; Audience may also ask follow up questions; Ann will moderate. Comms team will document the interview) • Sum up: Key points and emerging questions (volunteer, 5 mins)
Guidance: Afternoon Session Three Key Qs: We’ll take them one at a time KQ1: Considering the full set of progress markers for each boundary partner, how much progress has there been towards intended outcomes? Process: • 20 mins max to prepare your findings and display them on flip charts (for each boundary partner. • 15-20 mins to visit the display of the other team and ask questions • Team members take it in turns to stay with your flip charts and explain/respond questions of visitors
Guidance: Afternoon Session KQ2: How relevant were your PMs? Process: • Using the computer, carry out an analysis for each BP: highlighting the relevant/useful PMs in green; the irrelevant PMs in red; and identify any PMs that you feel should have been part of the set. (20 mins) • Present your analysis (20 mins per team including Q&A) • Haile: Observations, comments, feedback
Guidance: Afternoon Session KQ3: What do today’s exercises today tell us about: • how change (expected & unexpected) happens • the applicability and usefulness of progress markers and of OM in general in imGoats? Process: • Group discussion using fishbowl technique facilitated by Ewen (max 30 mins) Summary: Key points and emerging questions from this entire session (Kees, 5-10 mins) Closing Reflections: Tezira, Dr. Hegede