Download
1 / 79
840 likes | 981 Views
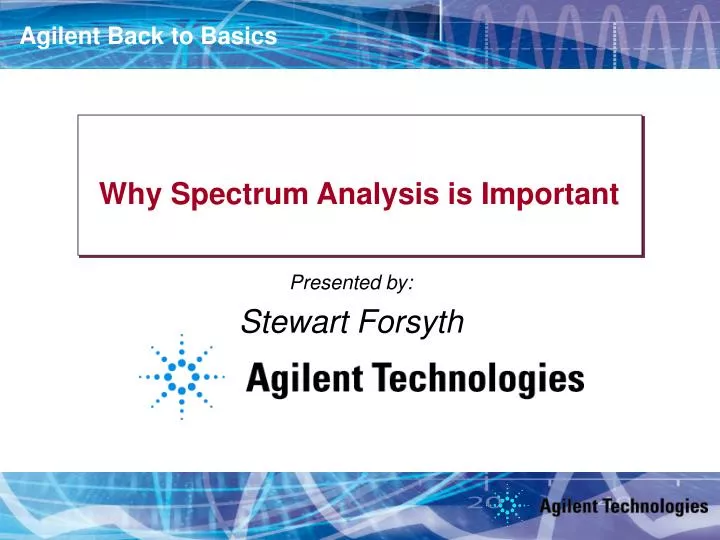
Why Spectrum Analysis is Important. Agenda. Introduction Overview: What is Signal Analysis? What Measurements are available? Theory of Operation Specifications Modern Signal Analyzer Designs & Capabilities Wide Bandwidth Vector Measurements Wrap-up Appendix.

E N D
Agenda • Introduction • Overview: • What is Signal Analysis? • What Measurements are available? • Theory of Operation • Specifications • Modern Signal Analyzer Designs & Capabilities • Wide Bandwidth Vector Measurements • Wrap-up • Appendix
Overview What is Signal, Vector and Spectrum Analysis? Spectrum Analysis • Display and measure amplitude versus frequency for RF & MW signals • Separate or demodulate complex signals into their base components (sine waves)
Agilent SA Products Code Compatible PSA Market Leading Performance 3 Hz to 50 GHz New MXA Super Mid Performance 20 Hz to 26 GHz Price EXA World’s “Soon To Be” Most Popular 9KHz to 26 GHz New New ESA World’s Most Popular 100 Hz to 26 GHz CSA Low cost portable 100 kHz to 6 GHz N9340A Handheld N9320A Benchtop Performance
Amplitude (power) frequency time Overview Frequency versus Time Domain Frequency Domain Measurements(Spectrum Analyzer) Time domain Measurements(Oscilloscope)
Overview Types of Measurements Available • Frequency, power, modulation, distortion & noise • Spectrum monitoring • Spurious emissions • Scalar network analysis • Noise figure & phase noise • Harmonic & intermodulation distortion • Analog, digital, burst & pulsed RF Modulation • Wide bandwidth vector analysis • Electromagnetic interference • Measurement range (-168 dBm to +30 dBm) • Frequency range (3 Hz to 325 GHz) Modulation Noise Spur Search Distortion
Overview Different Types of Analyzers FFT Analyzer Parallel filters measured simultaneously A LCD shows full spectral display f f f 2 1
Overview Different Types of Analyzers Swept Analyzer Filter 'sweeps' over range of interest A LCD shows full spectral display f f 2 f 1
Agenda • Introduction • Overview • Theory of Operation: • Swept Spectrum Analyzer Hardware • Specifications • Modern spectrum analyzer designs & capabilities • Wide Bandwidth Vector Measurements • Wrap-up • Appendix
Theory of Operation Swept Spectrum Analyzer Block Diagram RF input attenuator IF filter (RBW) envelope detector IF gain mixer Input signal Log Amp Pre-Selector Or Low Pass Input Filter video filter local oscillator sweep generator Crystal Reference Oscillator ADC, Display & Video Processing
Theory of Operation Display terminology Reference Level Amplitude Start Freq. Stop Freq. Center Freq. Freq. Span
MIXER + f f f - f sig sig LO LO f sig f f sig LO Theory of Operation Mixer RF IF LO 1.5 GHz f 3,6 GHz 6.5 GHz LO
IF Filter Theory of OperationIF Filter (Resolution Bandwidth – RBW) Input Spectrum IF Bandwidth (RBW) Display A B C
Before detector After detector Envelope Detector Theory of OperationEnvelope Detector
Envelope Detector ADC, Display & Video Processing Positive detection: largest value in bin displayed Negative detection: smallest value in bin displayed Sample detection: middle value in bin displayed Theory of OperationEnvelope Detector and Detection Types Digitally Implemented Detection Types bins/buckets* Other Detectors: Normal (Rosenfell), Average (RMS Power) *Sweep points
Envelope Detector ADC, Display & Video Processing Volts bin Time Theory of OperationAverage Detector Type Pos Peak detection x Sample detection x Neg Peak detection x Power Average Detection (rms) = Square root of the sum of the squares of ALL of the voltage data values in the bin /50Ω
Video Filter Theory of Operation Video Filter (Video Bandwidth – VBW)
Video Filter ADC, Display & Video Processing Theory of Operation Video Filter vs. Trace/Video averaging • Video Filter operates as the sweep progresses, sweep time may be required to slow down by the transient response of the VBW filter. • Trace/Video Average takes multiple sweeps, sweep time for each sweep is not affected • Many signals give the same results with either video filtering or trace averaging Trace averaging for 1, 5, 20, and 100 sweeps, top to bottom (trace position offset for each set of sweeps)
Theory of Operation Other Components LO SWEEP GEN LCD Display, ADC & Video processing RF INPUT ATTENUATOR IF GAIN
f s f f f - f f LO + LO s LO s f s f IF f LO Theory of Operation How it All Works Together - 3 GHz spectrum analyzer Signal Range LO Range 0 1 2 3 (GHz) IF filter mixer 0 1 detector 5 6 4 2 3 3.6 6.5 input 3.6 GHz sweep generator A LO 0 1 2 3 (GHz) f LCD display 6 5 (GHz) 4 3 3.6 6.5
Agenda • Overview • Theory of Operation • Specifications: • Which are important and why? • Modern spectrum analyzer designs & capabilities • Wide Bandwidth Vector Measurements • Wrap-up • Appendix
8563A SPECTRUM ANALYZER 9 kHz - 26.5 GHz Key Specifications • Safe spectrum analysis • Frequency Range • Accuracy: Frequency & Amplitude • Resolution • Sensitivity • Distortion • Dynamic Range
Specifications? A Definition • Specificationsdescribe the performance of parameters covered by the product warranty (temperature = 0 to 55°C, unless otherwise noted). • Typical values describe additional product performance information that is not covered by the product warranty. It is performance beyond specification that 80 % of the units exhibit with a 95 % confidence level over the temperature range 20 to 30° C. Typical performance does not include measurement uncertainty. • Nominal values indicate expected performance, or describe product performance that is useful in the application of the product, but is not covered by the product warranty.
! 0 V DC MAX +30dBm (1W) MAX SpecificationsPracticing safe spectrum analysis - Safe Hookups to RF Input • Use best practices to eliminate static discharge to the RF input! • Do not exceed the Damage Level on the RF Input! • Do not input signals with DC bias!
Description Specifications Internal Mixing Bands 0 3 Hz to 3.0 GHz 1 2.85 to 6.6 GHz 2 6.2 to 13.2 GHz 3 12.8 to 19.2 GHz 4 18.7 to 26.8 GHz 5 26.4 to 31.15 GHz 6 31.0 to 50.0 GHz External mixing 18 to 325 GHz Specifications Frequency Range
Specifications Accuracy: Frequency & amplitude • Components which contribute to uncertainty are: • • Input mismatch (VSWR) • • RF Input attenuator (Atten. switching uncertainty) • • Mixer and input filter (frequency response) • • IF gain/attenuation (reference level accuracy) • • RBW filters (RBW switching uncertainty) • • Log amp (display scale fidelity) • Reference oscillator (frequency accuracy) • • Calibrator (amplitude accuracy)
Absolute Amplitude in dBm Relative Amplitude in dB Absolute Frequency Amplitude Frequency Relative Frequency Specifications Absolute and relative Accuracy: Frequency & amplitude Note: Absolute accuracy is also “relative” to the calibrator reference point
Specifications Accuracy: Frequency Readout Accuracy Determined by Reference Accuracy • From the PSA Data Sheet: ± (freq readout x freq reference error +0.25%*span + 5% of RBW + 2Hz + 0.5 x Horiz. Res.*) RBW Error IF filter center frequency error Residual Error Span Accuracy *Horizontal resolution is span/(sweep points – 1)
Specifications Accuracy: Frequency Readout Accuracy Example Frequency: 1 GHz Span: 400 kHz RBW: 3 kHz Sweep points: 1000 Calculation:(1x10⁹Hz) x (±1.8x10⁻⁷/Year ref. Error) = 180Hz 400kHz Span x 0.25% = 1000Hz 3kHz RBW x 5% = 150Hz 2Hz + 0.5 x 400kHz/1000-1 = 202Hz Total uncertainty = ±1532Hz Utilizing internal frequency counter improves accuracy to ±180Hz
Specifications Accuracy: Key amplitude uncertainty contributions Relative and absolute:Sample Uncertainties • Input impedance mismatch (±0.13 dB) • Input attenuator switching uncertainty (±0.6 dB) • Frequency response (±1.8 dB) • Reference level accuracy (±1.0 dB) • RBW switching uncertainty (±0.5 dB) • Display scale fidelity (±0.85 dB) Absolute only: • Calibrator accuracy (±0.34 dB)
Absolute amplitude accuracy–Specification: ± 1 dB Relative amplitude accuracy – Specification:± 2 dB Specifications Accuracy: Frequency Response Signals in the Same Harmonic Band +1 dB 0 - 1 dB BAND 1
Specifications Accuracy: Display Fidelity • Display Fidelity includes: • Log Amp Fidelity • Envelope Detector Linearity • Digitizing Circuit Linearity • Display fidelity error applies when signals are not at the same reference level amplitude when measured • In the past, technique for best accuracy was to move each measured signal to the reference line, eliminating display fidelity error. Display Fidelity
Specifications Amplitude Accuracy: Reference Level Switching • Uncertainty applies when changing the Ref. Level • Also called IF Gain Uncertainty • Decision: Do I change the reference level or live with the display fidelity uncertainty in my measurements?
Specifications Amplitude Accuracy - Summary Optimize measurement setup & techniques for best accuracy • Minimize changes to uncertainty contributors • Or change contributor with least error impact • Or stay within the optimum accuracy envelope parameters that modern auto-alignment calibration techniques provide • Traditionally, one technique for best accuracy was to move each measured signal to the reference line, eliminating display fidelity error. However, in today’s designs, display fidelity has improved to the point where there is generally less error just to leave the signals where they occur on the display. • Except for freq. response, uncertainty contributors that impact both signals equally in a relative measurement can be ignored. • In the absence of specified relative freq. response, the relative response uncertainty is assumed to be 2x specified absolute error.
Resolution Bandwidth Specifications Resolution What Determines Resolution? RBW Type and Selectivity Noise Sidebands
Specifications Resolution: Resolution Bandwidth 3 dB Envelope Detector Mixer 3 dB BW Input Spectrum IF Filter/ Resolution Bandwidth Filter (RBW) LO Sweep RBW Display
10 kHz RBW 3 dB 10 kHz Specifications Resolution: Resolution BW Determines resolvability of equal amplitude signals
3 dB 3 dB BW 60 dB 60 dB BW 60 dB BW Selectivity = 3 dB BW Specifications Resolution BW Selectivity or Shape Factor Determines resolvability of unequal amplitude signals
Specifications Resolution BW Selectivity or Shape Factor RBW = 10 kHz RBW = 1 kHz Selectivity 15:1 3 dB distortion products 7.5 kHz 60 dB 60 dB BW = 15 kHz 10 kHz 10 kHz
Specifications Resolution: RBW Type and Selectivity Typical Selectivity Analog 15:1 Digital ≤5:1 ANALOG FILTER DIGITAL FILTER RES BW 100 Hz SPAN 3 kHz
Specifications Resolution: Noise Sidebands Phase Noise Noise Sidebands can prevent resolution of unequal signals
Penalty For Sweeping Too Fast Is An Uncalibrated Display Specifications Resolution: RBW Determines Sweep Time Meas Uncal Swept too fast
8563E Analog RBW SpecificationsResolution: RBW Type Determines Sweep Time PSA Digital RBW PSA FFT RBW 280 sec 134 sec 13.5 sec
RES BW Filter Specifications Sensitivity/DANL Detector Mixer RF Input LO Sweep A Spectrum Analyzer Generates and Amplifies Noise Just Like Any Active Circuit
Specifications Sensitivity/DANL Sensitivity is the Smallest Signal That Can Be Measured 2.2 dB Signal Equals Noise
Specifications Sensitivity/DANL Effective Level of Displayed Noise is a Function of RF Input Attenuation signal level 10 dB Attenuation = 20 dB Attenuation = 10 dB Signal To Noise Ratio Decreases as RF Input Attenuation is Increased
Specifications Sensitivity/DANL: IF Filter(RBW) Displayed Noise is a Function of IF Filter Bandwidth 100 kHz RBW 10 dB 10 kHz RBW 10 dB 1 kHz RBW Decreased BW = Decreased Noise
Specifications Sensitivity/DANL: Video BW filter (or Trace Averaging) Video BW or Trace Averaging Smoothes Noise for Easier Identification of Low Level Signals
INPUT - ATTENUATOR SETTING dBm POWER AT MIXER = Specifications Sensitivity/DANL: Signal-to-Noise Ratio Can Be Graphed 0 . -20 Displayed Noise in a 1 kHz RBW -40 SIGNAL-TO-NOISE RATIO, dBc -60 -80 -100 -60 -30 0 +30 Displayed Noise in a 100 Hz RBW
Specifications Sensitivity/DANL: Summary For Best Sensitivity Use: • Narrowest Resolution BW • Minimum RF Input Attenuation • Sufficient Averaging (video or trace)