Download
1 / 24
310 likes | 784 Views
Spectral Methods in EEG Analysis. Steven L. Bressler Cognitive Neurodynamics Laboratory Center for Complex Systems & Brain Sciences Department of Psychology Florida Atantic University. Overview. Fourier Analysis Spectral Analysis of the EEG Cross-Correlation Analysis

E N D
Spectral MethodsinEEG Analysis Steven L. Bressler Cognitive Neurodynamics Laboratory Center for Complex Systems & Brain Sciences Department of Psychology Florida Atantic University
Overview • Fourier Analysis • Spectral Analysis of the EEG • Cross-Correlation Analysis • Spectral Coherence • Parametric Spectral Analysis • AutoRegressive Modeling • Spectral Analysis by AR Modeling • Spectral Granger Causality • BSMART
Fourier Analysis Joseph Fourier (1768-1830) was a French mathematician who is credited with first introducing the representation of a mathematical function as the sum of trigonometric basis functions.
Spectral Analysis of the EEG Log power spectrum of sleeping rat EEG. 16-second EEG segment from a sleeping rat. (B-E) Corresponding power time series in delta, theta, alpha, and beta frequency bands.
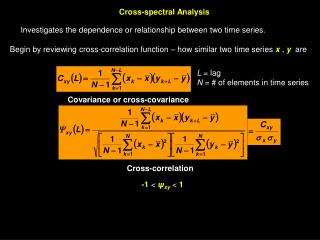
Correlation Analysis Auto-correlations (left) and cross-correlations (right) between respiratory and EEG time series. Note: Cross-correlation is a function of time lag. Awake mouse respiratory wave and somatosensory EEG time series.
Spectral Coherence Spectral coherence between two time series, x(t) and y(t), is the modulus-squared of the cross-spectral density divided by the product of the auto-spectral densities of x(t) and y(t). The coherence is the spectral equivalent of the cross-correlation function. The spectral coherence is bounded by 0 & 1 at all frequencies: 0 ≤ Coh2(f) ≤ 1. If x & y are independent processes, then the cross-spectral density is 0 at all frequencies, and so is the coherence. If x & y are identical processes, then the auto-spectral densities are equal, and are equal to the cross-spectral density, and the coherence is 1 at all frequencies.
Spectral Coherence • The coherence measures the interdependence of processes x and y – it reflects the distribution across frequency of activity that is common to x and y. • Example: Two EEGs (e.g. from left & right motor cortices) may be largely independent of each other, but synchronized at times within a narrow frequency range (e.g. during coordinated bilateral movement). • In this example, x and y are only interdependent in this frequency range coherence is high (near one) for these frequencies and low (near zero) at all other frequencies.
The Coherence Spectrum is Related to the Distribution of Relative Phase
Case I Case II Y Xhas a narrow distribution The resultant vector sum is high the coherence is high Y Xhas a wide distribution The resultant vector sum is low the coherence is low Coherence and Relative Phase Distribution
Experimental Example High Coherence Low Coherence
Parametric Spectral Analysis • EEG time series are stochastic, i.e. they can be represented as a sequence of related random variables. • Statistical spectral analysis treats EEGs as time series data generated by stationary stochastic (random) processes. • Unlike nonparametric spectral analysis, which computes spectra directly from time series data by Fourier analysis, parametric spectral analysisderives spectral quantities from a statistical model of the time series. • In the model, the EEG at one time is expressed by statistical relations with the EEG from past times. • The parametric model is typically autoregressive, meaning that each time series value is modeled as a weighted sum of past values (the weights being considered as the parameters of the model). • Parametric modeling allows a precise time-frequency representation of the EEG (Ding et al. 2000; Nalatore & Rangarajan 2009). • It also serves as a theoretically sound basis for directed spectral analysis (Ding et al. 2006; Bressler & Seth 2011).
The AutoRegressive Model Xt= [a1Xt-1 + a2Xt-2 + a3Xt-3 + … + amXt-m] + εt where X is a zero-mean stationary stochastic process, ai are model coefficients, m is the model order, and εt is the white noise residual error process.
The MultiVariateAutoRegressive (MVAR) Model Xi,t= ai,1,1X1,t-1 + ai,1,2X1,t-2 + … + ai,1,mX1,t-m + ai,2,1X2,t-1 + ai,2,2X2,t-2 + … + ai,2,mX2,t-m + … + ai,p,1Xp,t-1 + ai,p,2Xp,t-2 + … + ai,p,mXp,t-m + ei,t Xt = A1Xt-1 + + AmXt-m + Et where: Xt = [x1t , x2t , , xpt]T are p data channels, m is the model order,Ak are p x p coefficient matrices, & Et is the white noise residual error process vector.
MVAR Modeling ofEvent-Related Neural Time Series • Repeated trials are treated as realizations of a stationary stochastic process. • Ak are obtained by solving the multivariate Yule-Walker equations (of size mp2), using the Levinson, Wiggens, Robinson algorithm, as implemented by Morf et al. (1978). Morf M, Vieira A, Lee D, Kailath T (1978) Recursive multichannel maximum entropy spectral estimation. IEEE Trans Geoscience Electronics 16: 85-94 • The model order is determined by parametric testing.
Spectral Analysis by MVAR Modeling • The Spectral Matrix is defined as: S( f ) = <X (f ) X (f )*> = H(f ) H*(f ) where * denotes matrix transposition & complex conjugation; is the covariance matrix of Et ; and is the transfer function of the system. • The Power Spectrum of channel k is Skk ( f ) which is the k th diagonal element of the spectral matrix.
Identification of EEG Oscillatory Activity from AR Power Spectra
Coherence Analysis by MVAR Modeling • The (squared) Coherence Spectrum of channels k & l is also derived from thespectral matrix as the magnitude of the cross-spectrum normalized by the two auto-spectra: Ckl( f ) = |Skl( f )|2 / Skk( f ) Sll( f ).
Statistical Causality For two simultaneous time series, one series is called causal to the other if we can better predict the second series by incorporating knowledge of the first one (Wiener, The Theory of Prediction, 1956).
Granger Causality Granger (1969) implemented the idea of causality in terms of autoregressive models.Let x1, x2, …, xtand y1, y2, …, yt represent two time series. Granger compared two linear models: xt = a1xt-1+ … + amxt-m+t and xt = b1xt-1+ … + bmxt-m + c1yt-1+ … + cmyt-m+ t
Granger Causality If Then, in some suitable statistical sense, we can say that the y time series has a casual influence on the x time series.
Granger Causal Spectrum Geweke (1982) found a spectral representation of the time domain Granger causality (Fyx): The Granger Causal Spectrum from y to x is: where is the covariance matrix of the residual error, His the transfer function of the system, and Sxx is the autospectrum of x.
BSMARTA Matlab/C Toolbox for Analyzing Brain Circuits • BSMART, an acronym of Brain-System for Multivariate AutoRegressiveTimeseries, is an open-source, downloadable software package for analyzing brain circuits. • BSMART is a project that was born out of a collaborative research effort between Dr. Hualou Liang at Drexel University, Dr. Steven Bressler at Florida Atlantic University, and Dr. Mingzhou Ding at University of Florida. • BSMART can be applied to a wide variety of neuroelectromagnetic phenomena, including EEG, MEG and fMRI data. • A unique feature of the BSMART package is Granger causality that can be used to assess causal influences and directions of driving among multiple neural signals. • The backbone of the BSMART project is MultiVariateAutoRegressive (MVAR) analysis. • The MVAR model provides a plethora of spectral quantities such as auto power, partial power, coherence, partial coherence, multiple coherence and Granger causality. • The approach has been fruitfully used to characterize, with high spatial, temporal, and frequency resolution, functional relations within large scale brain networks. • BSMART is described in:JieCui, Lei Xu, Steven L. Bressler, Mingzhou Ding, Hualou Liang, BSMART: a Matlab/C toolbox for analysis of multichannel neural time series, Neural Networks, Special Issue on Neuroinformatics, 21:1094 - 1104, 2008. • Download BSMART at http://www.brain-smart.org.