Download
1 / 23
250 likes | 436 Views
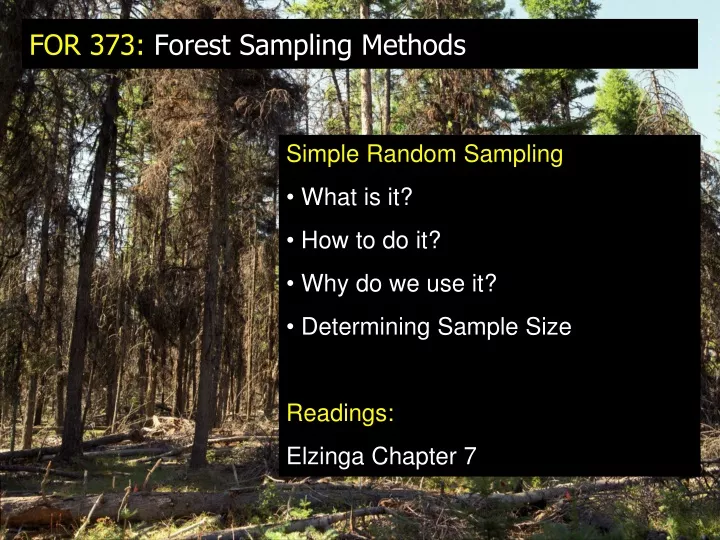
Simple Random Sampling What is it? How to do it? Why do we use it? Determining Sample Size Readings: Elzinga Chapter 7. FOR 373: Forest Sampling Methods. “In simple random sampling every possible combination of sampling units has an equal and independent chance of being selected”

E N D
Simple Random Sampling • What is it? • How to do it? • Why do we use it? • Determining Sample Size • Readings: • Elzinga Chapter 7 FOR 373: Forest Sampling Methods
“In simple random sampling every possible combinationof sampling units has an equal and independent chance of being selected” Avery and Burkhart Simple Random Sampling: What is it
This does not mean that each sample has an equal probability of being selected. For example, these stands may have 80% PIPO and 20% ABGR Simple Random Sampling: What is it
A random sample is one in which the selection of a particular sample does not depend on whether another sample has been chosen: Independent Samples Simple Random Sampling: What is it
Random Number Generation: Assign each square a number and make a random number generator select them. Then sample them in that order. Simple Random Sampling: How to do it
Simple Random Sampling is often used to evaluate thevariance of a unit when we do not knoweither what the stand boundaries are or what underlying environmental variables may influence the variability. Simple Random Sampling: Why do we use it Simply put: When we do not know enough to stratify the unit and before we can plan a proper sampling design we need to collect some preliminary data
Therefore, we randomly sample a unit to determine the Coefficient of Variation (CV) and this allows us to calculate how many plots we will need in our inventory Simple Random Sampling: Why do we use it
Two main kinds of simple random sampling are used in forestry: 1. With Replacement 2. Without Replacement Simple Random Sampling: The two main kinds
With Replacement: Each sampling unit is allowed to be sampled as often as it is selected Simple Random Sampling: With Replacement
Without Replacement: Each sampling unit can only be sampled once and is effectively removed from the population once sampled Simple Random Sampling: Without Replacement The majority of forest sampling is done without replacement. However, other disciplines use with replacement methods
Consider evaluating the abundance of animals purely by sampling the number in visual range at random points Simple Random Sampling: An Example of Wildlife These approaches are called mark-recapture methods Recommended Reading: Elzinga et al Chapter 13 (full book)
The Premise: A sample of animals are caught and tagged (say 70) and then allowed to remix with the population At a subsequent sample: the % of tagged animals re-caught (say 10%) is assumed to represent the % of the tagged to the whole population Total Population = 70/10*100 = 700 Simple Random Sampling: An Example of Wildlife ** Class Courtyard Flagging Example
Mark-Recapture Limitations. Very Time Consuming: To achieve a precision of ±10% for a population of 200 you need to sample 90% of the population! Sampling Changes the Properties of the Population of Interest: Being there changes the very habitat you wish to observe – Essentially Heisenberg's Uncertainty Principal Simple Random Sampling: An Example of Wildlife Recommended Reading: Elzinga et al Chapter 13 (full book)
Mark-Recapture Limitations: • Tags may be lost • Tagged animals may be less prone to recapture • Tagged animals may be affect its social status or health • Same sub-population may not mix with larger population Simple Random Sampling: An Example of Wildlife Recommended Reading: Elzinga et al Chapter 13 (full book)
For both with and without replacement methods, the population mean is calculated using this equation: Simple Random Sampling: Getting Information
The With Replacement (or infinite population) Standard Error: Simple Random Sampling: Getting Information The Without Replacement (or finite population N) Standard Error: The difference is called the finite population term:
To plan ANY forest inventory its needs to be statistically valid while practical. Enough samples must be collected to obtain an estimate of the inventory to a reasonable precision. Too many is a waste. Too few will make the errors to high. Simple Random Sampling: So Why do We Care? The preliminary data from Simple Random Samplingand the standard errorallows us to determine exactly how many plots we will need.
Based on this information we can now calculate the number of sampling plots we will need in our inventory: n = samples to estimate mean to ± E t = t-value from students t-test table s = standard deviation from a prior work E = standard error of the mean Simple Random Sampling: Getting Information
Or when using percentage error we could calculate sample size or number of plots by using the following equation: n = samples to estimate mean to ± E t = t-value from students t-test table s = variance from a prior work E = allowable % error Simple Random Sampling: Getting Information
t-values table: A Work Through Example Sampling: How Many Sampling Units Degrees of Freedom = n-1 Need to estimate n to get t-value
t-values table: A Work Through Example Sampling: How Many Sampling Units Let n = 4, then for 80% probability the t-value = 1.6377
t-values table: A Work Through Example Sampling: How Many Sampling Units We have: n = 4, t-value = 1.6377 Calculate sample size using E= 10% and a CV of 30 Then you recalculate your degrees of freedom with the new n value until n repeats (changing your t-value). DF= 23 (t= 1.3195) DF= 15 (t= 1.3406)
Sampling: How Many Sampling Units t-values from Excel