Download
1 / 27
280 likes | 287 Views
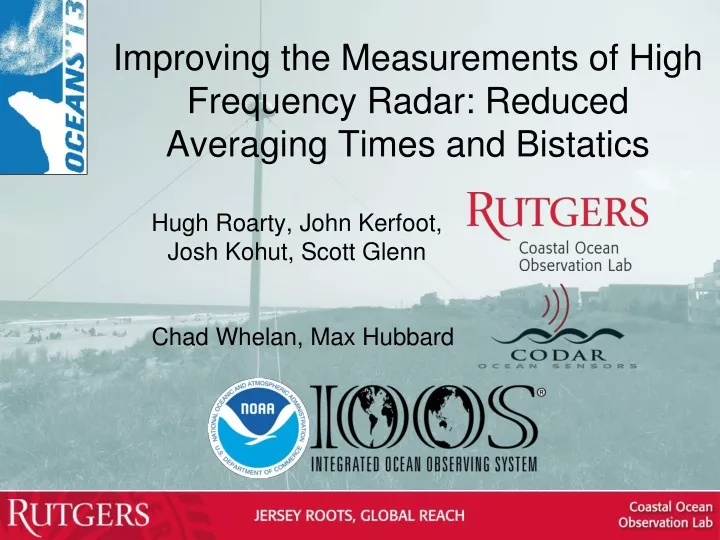
Improving the Measurements of High Frequency Radar: Reduced Averaging Times and Bistatics. Hugh Roarty, John Kerfoot, Josh Kohut, Scott Glenn. Chad Whelan, Max Hubbard. Rutgers University - Coastal Ocean Observation Lab Operations, Research & Education Center. Vessels - Satellite.

E N D
Improving the Measurements of High Frequency Radar: Reduced Averaging Times and Bistatics Hugh Roarty, John Kerfoot, Josh Kohut, Scott Glenn Chad Whelan, Max Hubbard
Rutgers University - Coastal Ocean Observation Lab Operations, Research & Education Center Vessels - Satellite Satellite CODAR Ships/ Vessels Glider REMUS Data Vis. Modeling Security Leadership Education Glider Fleet Satellite Data Acquisition Stations CODAR Network 3-D Forecasts
CODAR Compact HF Radar Antennas 25 MHz 13 MHz 5 MHz Separate Transmitter & Receiver Combined Transmitter & Receiver
Surface Current Mapping Capability 25 MHz Radar l: 12 m Ocean l: 6 m Range: 30 km Resolution: 1 km 13 MHz Radar l: 23 m Ocean l: 12 m Range: 80 km Resolution: 3 km 05 MHz Radar l: 60m Ocean l: 30 m Range: 180 km Resolution: 6 km
MARACOOS Annual Mean Surface Currents (2009) Winter Spring Summer Fall
Existing SeaSonde Settings SeaSonde Acquisition CSPro Analyze Spectra
1 CSS 98% 3 CSS 96% 5 CSS 92% 7 CSS 86%
5 MHz Shorter Averaging Intervals
NAUS NANT BLCK MRCH WILD
Average Radial Velocity RDLi_BRMR_2012_08_1300 RDLi_BRMR_2012_08_1400 RDLi_BRMR_2012_08_1500 5 cm/s 7 cm/s 10 cm/s
Next Steps Look at totals between 3 hour and 1 hour files Adjust generation of CSQ and CSS files to measure effects
13 MHz Bistatics for surface currents
Enhancing the Network with Bistatics 3 radars can provide 6 measurements
Total Surface Currents Three Weeks August 30 – September 20, 2013 6 Radial Stations
Total Surface Currents Three Weeks August 30 – September 20, 2013 6 Radial Stations & 5 Elliptical Pairs
Conclusions • Shorter averaging intervals can increase tidal amplitude measurement • Bistatics increase coverage and reduce uncertainty