Download
1 / 6
60 likes | 197 Views
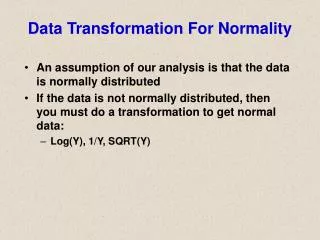
Assessing Normality. When is the data Normal enough?. Use the 68-95-99.7 Rule. Plot the data and check for the shape to be……. Determine if ____ % of the data is within 1 standard deviation Determine if 95% of the data is within ___ standard deviations

E N D
Assessing Normality When is the data Normal enough?
Use the 68-95-99.7 Rule • Plot the data and check for the shape to be……. • Determine if ____ % of the data is within 1 standard deviation • Determine if 95% of the data is within ___ standard deviations • Determine if ____ % of the data is within ____ standard deviations
Normal Probability Plot • X-axis is the data scale • Y-axis is the z-score scale • All data is converted to its z-score and plotted as (data, z-score) • Data should appear linear if it is Normal
Shape from Normal Probability Plot • Symmetric = Linear • Skewed Right = few large values, so large x-values will fall to the right of the line • Skewed left = few small values, so small values will fall to the left of the line
ENTER IN YOUR CALC IN L1 Refrigerator Space The following is a sample of 36 side-by-side refrigerators and their capacity (in cubic feet). Are the data close to Normal?
My Calculator Example On the Emulator