Download
1 / 15
150 likes | 254 Views
2006 SAV Forecast Michael Williams (UMCES/CBPO) TMAW, 12/7/06. 2006 Forecast. Case studies for 2006 forecast : Susquehanna Flats, Tangier Sound, Choptank River, Potomac River, York/Mobjack River, Patuxent River March - May 2006 field trips to assess the spring abundance of SAV

E N D
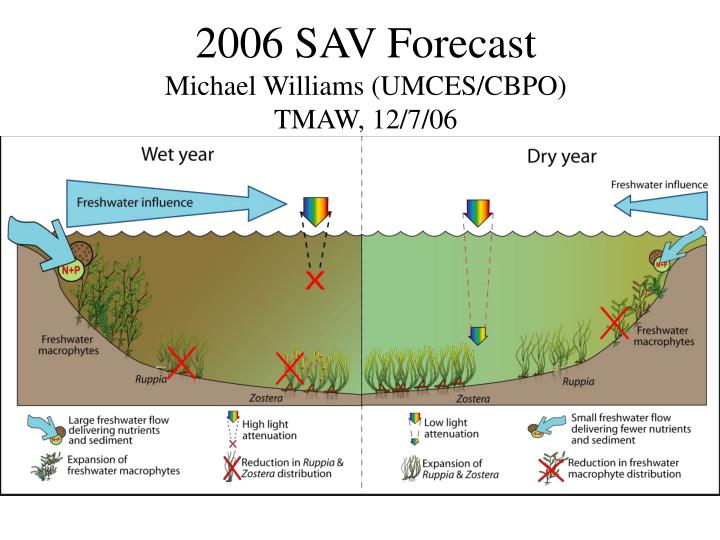
2006 SAV ForecastMichael Williams (UMCES/CBPO) TMAW, 12/7/06
2006 Forecast • Case studies for 2006 forecast: • Susquehanna Flats, Tangier Sound, Choptank River, Potomac River, York/Mobjack River, Patuxent River • March - May 2006 field trips to assess the spring abundance of SAV • Development of site-specific relationships April-May • 2006 SAV forecast ready by late May
Dependent variables • SAV by area coverage, % change from previous year, and density • Independent variables • 1) Previous year’s growing season and 2) Spring: • flow, N and P loads (RIMP and BFL point sources), flow-adjusted loads, TSS, Chl a, Secchi, salinity, surface water temp, rate of change in spring surf water temp, PAR, and wind speed and direction • min, max, median, and variance were also analyzed for some parameters
Results (TANMH) • Correlations • PY Secchi (r=0.66, p=0.002) • PY wind speed (r=-0.60, p=0.018) • Univariate (area coverage) • PY Secchi • Stats: r2 = 0.55, p = 0.0016 • Stepwise MLR (at p<0.05) • Same as univariate model
Results (Potomac) • Correlations • Flow-adj. TN (r=-0.59, p=0.011) • BFL TN loads (r=-0.47, p=0.047) • Surf. Temp (r=-0.41, p=0.083) • Univariate (area coverage) • Flow-adj. TN load • Stats: r2 = 0.34, p = 0.01 • Stepwise MLR (at p<0.05) • Same as univariate • Class 3 density • Secchi • Stats: r2 = 0.32, p = 0.03
Results (CB1TF) • Correlations • Flow-adj. TN (r=-0.66, p=0.002) • PY wind speed (r=-0.68, p=0.001) • Univariate (area coverage) • Flow-adj. TN load • Stats: r2 = 0.46, p = 0.002 • Stepwise MLR (at p<0.05) • Same as univariate • Class 2 density • Secchi • Stats: r2 = 0.73, p < 0.0001
Relationships of area coverage (AC) and various independent parameters for the six SAV communities used in this analysis.
2006 Forecast • Univariate and/or multiple linear regressions explain 32% to 85% of SAV variance • Models indicate that most case study areas will be similar or decrease in SAV area; Pax & MH Potomac will increase • These are somewhat in contrast to predictions from field observations • Effect of reduced N loads needs to be viewed with caution (i.e., is N a causative factor?). However, it is interesting that areas less directly affected by N loading (i.e., Tangier and Mobjack) do not show the increases in SAV area observed in several other case study areas
December Update • High salinity areas (e.g., Tangier): Decrease due to 2005 dieback • Mid-salinity areas: Mixed bag. Even within a single system SAV is both up and down. Decrease in Honga and increase off Barren Island. Increase at Bloodsworth and South Marsh islands (widgeongrass) • Lower salinity areas: Abundant around Flats, Elk and Bohemia. Big decrease in the Chester and around Eastern Neck Islands • TF Potomac: Great but still little regrowth from the WW bridge to DC. Good in St Mary's , Breton and St Clements bays • Choptank: Gone in north parts during flights (Harris and Broad creeks) but abundant in the south side around Chapel Creek – (JJ’s comment: “go figure - of course it’s widgeongrass again!”) • Severn and Magothy rivers: abundant SAV, but milfoil increase (2005 Patapsco) gone in 2006 (higher spring salinities?)
Potential Improvements • New case study areas • Other parameters (independent & dependent) • SAV cover = Density_class_1_area * 0.189 + Density_class_2_area * 0.369 + Density_class_3_area * 0.538 + Density_class_4_area * 0.755 • Others?