Download
1 / 30
300 likes | 434 Views
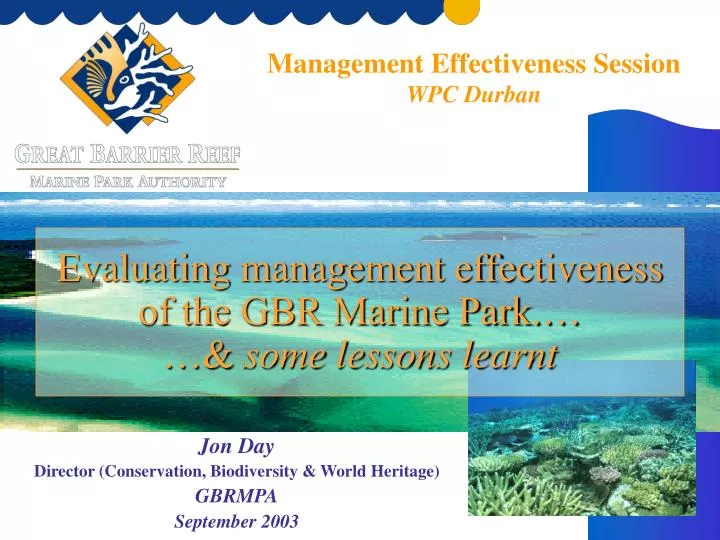
Management Effectiveness Session WPC Durban. Evaluating management effectiveness of the GBR Marine Park.… …& some lessons learnt. Jon Day Director (Conservation, Biodiversity & World Heritage) GBRMPA September 2003. The Great Barrier Reef.

E N D
Management Effectiveness Session WPC Durban Evaluating management effectiveness of the GBR Marine Park.……& somelessons learnt Jon Day Director (Conservation, Biodiversity & World Heritage) GBRMPA September 2003
The Great Barrier Reef GBR is not a typical MPA in terms of its size or its complexity…. …..but some of the lessons learnt may be of relevance to other MPAs.
Evaluating management effectiveness in GBR • A wide range of monitoring, research & management tasks currently undertaken • Address specific ecological, biophysical, social or governance aspects • Most can assist in evaluating management effectiveness
Monitoring in the GBR • Variety of monitoring - long-term (site specific & regional scales); reactive/ impact assessment (generally site-specific); compliance (issue-specific) • Considerable other monitoring occurring: • Day-to-day management monitoring • Community/volunteer monitoring eg. • COTSWATCH • ‘Eye on the Reef ‘
Vessel Monitoring System Socio-economic • Log book data for all fisheries • Spatial/temporal changes in use patterns • Value (eg. GVP, days of effort)
Socio-economic (cont.) • Permits issued – location, type • Visitor use patterns • EMC data sets • Visitor surveys • Community surveys • Reef visitor perception surveys
Governance • 3Yr Rolling Programs & Annual reports for DDM • Enforcement coverage – no. of patrols • Enforcement statistics • Education/interp programs • Zoning Plans • Level of public participation • Stakeholder involvement • Meetings of LMACs & RACs • Outcomes • Expenditure by mgt activity
Evaluating management effectiveness in GBR • Generally ‘stand-alone’ tasks • Requirement arising from Audit review • Only recently has integration been considered • Still viewed as an ‘add-on’, rather than a key task or part of ongoing planning cycle
Monitoring - lessons learnt • No monitoring program is perfect when first set up • Recognising both ‘natural’ & ‘human-induced’ changes • Monitoring results/trends can sometimes take a long time (often outside management & political timeframes) • Report outputs/outcomes in simple formats if possible • Value of quick, easily accessible results • Monitor ‘outside the square’ (put MPA in broader context) • Consider new technologies (c.f. destructive sampling) • If possible, use field managers/users to assist with monitoring • Problems of ‘shifting baselines’
“Shifting baselines” “Each generation accepts the species composition and stock sizes that they first observe as a natural baseline from which to evaluate changes. This ignores the fact that this baseline may already represent a disturbed state. The resource then continues to decline, but the next generation resets their baseline to this newly depressed state. The result is a gradual accommodation of the creeping disappearance of resource species, and inappropriate reference points .…..” Pauly 1995
Dugong in the GBR Aerial surveys since mid 1980’s: • Recent increase represents small fluctuation in a population that is far fewer than existed in the 1960s • GBR dugong population (south of Cooktown) “is a fraction (~ 3%) of what it was decades ago”
Indicators/triggers Examples of indicators/triggers in GBRMP: Water quality • Chlorophyll a concentration targets • End-or catchment discharge targets (sediment, N, P) East Coast Trawl Management Plan • Decrease in level of effort in 1st year and subsequent years • Level of by-catch • No. of boats involved in illegal activities Conservation – review of zoning (representative areas) • Biophysical Operating Principles
Trawl Audit Report • 205 page report • 40 specific & technical recommendations • 34 tables with data • 24 graphs presenting fishery trends • areas for improvement • further research req’d • a public document on GBRMPA’s websitewww.gbrmpa.gov.au Audit of the Management of the Queensland East Coast Trawl Fishery in the Great Barrier Reef Marine Park Report prepared by Dorothea Huber, Senior Project Manager Fisheries Issues Group, Great Barrier Reef Marine Park Authority May 2003
Problems if percentages (eg 20%) applied in isolation or as a target The Biophysical & SEC Operating Principles Biophysical principles (developed by tropical marine expert scientists) 1.Min. size 20km across 2. Larger is better 3. Replicate to reduce risk 4. Don’t split reefs (don’t split zone) 5,6. At least 20% per reef/non reef bioregion … 7. Consider cross-shelf & latitudinal diversity 8. Include eg.s of all community types & physical environments 9. Consider marine ‘connectivity’ 10. Consider special & unique sites 11. Consider adjacent uses Social, economic, cultural & management principles 1.Maximise complementarity with adjacent uses 2. Recognise social benefits / costs 3. Complement existing & future management 4. Maximise public understanding & enforceability
Indicators – lessons learnt • Not practical/necessary to develop indicators for every objective. • Indicators must reflect changes at spatial and temporal scales of relevance to management. • Dynamic systems (= huge variability in nature)…. challenge is to develop performance indicators that are robust to the many sources of uncertainty • Don’t create ‘sunset clauses’ that require demonstrable conservation results after a fixed, and often short, time in operation. • Problems of targets, particularly if using simplistic formulae: • spatial targets (what happens elsewhere?)
Monitoring in ever-changing environment Hence need for adaptive management Need to be cognizant of changes in all MPAs: • rapidly changing patterns of use • technological change • social- economic changes • political change • dynamic systems natural changes
Adaptive management “…..managing according to a plan by which decisions are made and modified as a function of what is known and learned about the system, including information about the effect of previous management actions”. Parma et al (1998)
Dugong recognised as a special value of the GBRWHA with world-wide declining populations Further monitoring & research Monitoring of dugong populations in the Marine Park Management Actions eg DPAs Concern re. apparent decline following 3 surveys (1986/87, 1992, 1994) Monitoring & adaptive management Monitoring Management decisions For example
The complexities of evaluating marine areas • Extent of interconnectedness • ‘downstream’ issues • MPA affected by surroundings • 3 dimensional • not easily viewed, delineated nor managed • logistics to monitor/manage • lack of knowledge & understanding
Different priorities /different agendas • Managers, researchers, local communities and politicians all have very different perspectives/ timeframes • Differing views on what are appropriate indicators • Challenges • need to clearly articulate management issues & objectives • work together to determine priorities for monitoring/evaluation • provide more effective and timely information for managers
1994 A picture paints a thousand words….. 1890
Key Performance Indicators Clear links to Authority’s Goal & Portfolio Budget Statement
Most, if not all, management approaches need to be periodically reviewed and updated. No successful management regime can be inflexible to new information. Need to consider a wider context than just your MPA Monitoring/evaluation should concentrate on the most important issues affecting or potentially affecting your MPA (eg WQ) Aim to get monitoring & evaluation as part of the management/planning cycle Evaluating mgt effectiveness - lessons learnt
Conclusions • Recognition that monitoring, evaluation and adaptive management are all fundamental components for effective resource management. • Reporting is now a requirement of Government. • MPAs are dynamic – evaluation needs to determine what change is ‘acceptable’ Vs what is ‘not acceptable’ • Precautionary principle – can’t afford to wait for perfect science before taking management action.
Conclusions (cont) • Outcomes of evaluation must be presented in a manner which is useable/understandable to those who were not involved in developing the monitoring (if possible, use pictures, graphs) • Learn from previous management actions to improve ongoing management (ie adaptive management). • The main excuses for not evaluating performance …. ….. institutional barriers, high costs, concern about ‘what it might show’ & lack of political support.
Particular thanks to my GBRMPA colleaguesFor more information about GBRMPA’s activities:www.gbrmpa.gov.au THANK YOU