Download
1 / 16
170 likes | 377 Views
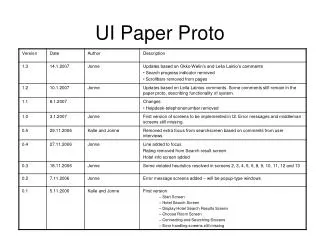
Results of PROTO-PINCH Testbench for the PROTO-SPHERA experiment. F. Alladio, L.A. Grosso, A. Mancuso , S . Mantovani, P. Micozzi , G. Apruzzese, L. Bettinali, P. Buratti, R. De Angelis, G. Gatti, G. Monari, M. Pillon, A. Sibio, B. Tilia, O. Tudisco

E N D
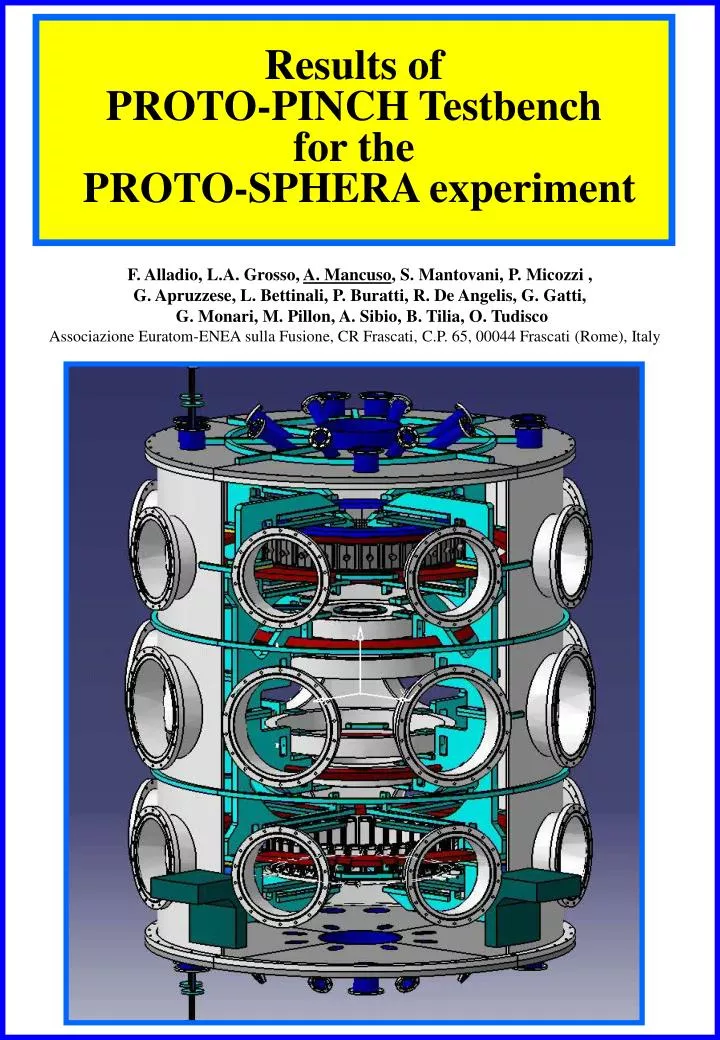
Results of PROTO-PINCH Testbench for the PROTO-SPHERA experiment F. Alladio, L.A. Grosso, A. Mancuso, S. Mantovani, P. Micozzi , G. Apruzzese, L. Bettinali, P. Buratti, R. De Angelis, G. Gatti, G. Monari, M. Pillon, A. Sibio, B. Tilia, O. Tudisco Associazione Euratom-ENEA sulla Fusione, CR Frascati, C.P. 65, 00044 Frascati (Rome), Italy
High T • Higher MHD stability and high average total beta values: bT=2m0<p>Vol/BT2(bT=40% with baxis=70% on START) Some ULART Features START : relatively high energy confinement times and density limits with H-mode in NBI X-point discharges • The bpol=2m0<p>Vol/Bpol2 marks the distance from a force free-state ( jÙB =0). • In an ST( Bpol ~ BT ) • A high bT (40%) plasmain an ST is much nearer to a force-free configuration than a low bT (4%) plasma in a Tokamak • Reasons to push towards the Ultra Low Aspect Ratio Torus (ULART, A ≤ 1.3) • the critical central conductor cannot be shielded • it is bombarded by neutrons (cannot be a superconductor) • it should be periodically replaced • But the ULART does not leave enough space for an ohmic transformer and requires noninductive current drive
Magnetic line of forces Spherical Torus Conventional Tokamak Field line in Bad Curvature region Geodesic Curvature Neoclassical transport Micro-instability related to trapped particles High Low Low High High Low High Low Aims of PROTO-SPHERA(Spherical Plasma for Helicity Relaxation) • Test an ULART, with central conductor substituted by a current carrying plasma (arc discharge) • Force-free Screw Pinch fed by two "polar caps" electrodes placed along the expansions of the ULART internal divertor regions • "Bumpy Z-Pinch" or "Flux-Core Spheromak“ [Jensen and Chu, J. Pl. Phys., '81], [Turner, Phys. Fl., '84], [Taylor, NF, '89] Helicity Injection Feed Schema of the Spherical Torus + Screw Pinch
PROTO-SPHERA Plasma Formation The idea is to form an ULART by producing a Screw Pinch that will be destabilized by increasing the longitudinal arc current Ie: such a configuration has been obtained for the first time on the TS-3 experiment (Tokyo University) Screw Pinch with longitudinal field BZ toroidal field Bfsafety factor qPinch = 2prPinch BZ/LPinch Bf The non-linear phase of the instabilityconverts toroidal flux in poloidal flux
Comparison Ie = 40 kAPinch current Ie = 60 kA Ip = 50 kAULART current Ip = 240 kA A = 1.6Aspect Ratio A ≤ 1.2 tpulse = 80 ms 120 AlfvénPulse duration tpulse ≥ 50 ms 1 R • MainDifferences with TS-3 • PROTO-SPHERA has larger plasma elongation:k 2.3, to get qaxis 1 and qy 2.5-3 • PROTO-SPHERA aims at sustaining the configuration more than tR=m0a2/h (one resistive time)when TS-3 achieved ≤120•tA (120 Alfvén times; tA=Raxis/vA) • PROTO-SPHERA aims at obtaining a dimensionless Lundquist number S=tR/tA 105, whereas TS-3 had S=tR/tA 4400. TS-3 PROTO-SPHERA
Anode W-Cu Indium Cu Cooling • Thermal Bridge : Indium • Modules : 32 • Sectors : 4
Mw Detector Spectroscopy DATA 140 GHz OSCILATOR Phase Shift • ProtoPinch experimental Studies • The arc breakdown. • The effects of arc current Ie≤1 kA, with qPinch≥ 2. • Test Anode material & conceptual design • Test Cathode material & conceptual design (1 module out of 100) PROTO-PINCH (Electrodes’ Testbench)
8 conductors for the Ie return Feedback Gas Feed Valve External coil. Visible Spectroscopy Diode Array Anode Pyrex vacuum vessel Microwave Interferometer Turbo Mol Vacuum Pump Cathode RotativeVacuum Pump Cathode Thermocouples Proto-Pinch Experimental Set-Up
Image of PROTO-PINCH Hydrogen plasma with Ie=600 A, B=1 kG. PROTO-PINCH has produced Hydrogen and Helium arcs in the form of screw pinch discharges. Pinch Length : 75 cm Stabilizing Field : 1.5 kG Safety Factor qPinch≥2 IPinchmax = 700 A IDenCathmax = 6 A/cm2 Vpinch = 100 V Vcathode = 20 V Proto-Pinch Discharges
Progress of PROTO-PINCH November ‘98 December ‘98 March ‘99 September ‘99 Ie=10 A Ie=70 A Ie=300 A Ie=670 A Main results of the PROTO-PINCH • Solution for the 5 cm diameter electrodes : a directly heated (AC) W-Th(2%) cathode and a Cu-W hollow anode, with H2 (or He) puffed through it. • The Hydrogen pinch breakdown occurs in the filling pressure range pH=1•10-3÷1•10-2 mbar, which is the same of a standard Tokamak discharge. • The pinch breakdown voltage is Ve≤100 V, which means that the insulation problems in PROTO-SPHERA should be quite easy to deal with. • The typical duration of a plasma pulse at Ie=600 A is 2÷5 s, limited by heating of Pyrex, rubber seals, etc… • The arc plasma is very clean: a few barely measurable impurity lines appear in Hydrogen and in Helium discharges at lowest filling pressures (1÷2•10-3 mbar). • Anode and cathode have withstood 400 discharges with the current and the power densities required for PROTO-SPHERA
Cathode Materials: Plates: Molybdenum Columns:Tantalum Insulator : Alumina. Coils : W-Th 2% Module Power = 8.4 Kw Module Current = 600 A Module Voltage = 14 V Wire Number = 4 Wire Diameter = 2 mm Wire Length = 40.0 cm Wire Surface = 25 cm2 Wire Temp = 2200-2400 °C Wire Em = 6 Amp/cm2 Wire Weight = 22 gr • Cathode Treats and Recipes • AC current for heating the cathode, to spread the ion plasma current over the filaments. • Wire preconditioning consists of flash heating at 2200 ºC for 1’, then 1 hour at 1800 ºC. • The time required for heating up the cathode before the plasma shot is about 15 s. • Most relevant results concerning the cathode heating • Ie=600-670 A of plasma current needs AC heating Icath=550-590 A (rms.) at Vcath=14.5 V (rms.) Ie/Icath 1. • Pcathode 8.5 kW allows for a power injection into the screw pinch plasma Pe 50-70 kW. • No Damages after 400 discharges. Extrapolation to the PROTO-SPHERA cathode • AC current to heat the cathode : Icathode= 60 kA (rms.) at Vcathode< 20 V (rms.); • The PROTO-SPHERA cathode will be composed of 126 (521 A each), modules similar to the PROTO-PINCH cathode connected in parallel in six groups (six-phased power supply able to deliver 10 kA per phase). • The overall cathode heating power will be Pcathode 850 kW. • The overall power injection into the PROTO-SPHERA plasma sheaths will be Pe 50 MW (Ie 60 kA at Ve 80÷90 V) • The ohmic input PPinch= 4.7 MW • Helicity injection power required for sustaining the torus, PHI=1.3 MW • A pinch power supply able to deliver 60 kA at 300 V will be adequate for all requirements.
Anode • The gas feedback system keeps pH=constant. • NoDamages after 1000 discharges. • Material W 90% Cu10%. • Schema : Pumped Divertor. Anchoring Ip=200 Amp Disanchoring 300 Amp • With cathode DC heated some anode arc anchoring. • No anchoring with AC cathode heating. • In PROTO-SPHERAsaddle coils to contrast arc anchoring should be inserted near electrodes . B=0.8 kG Cathode D.C B=0.8 kG Cathode D.C
Å Å Å Å Å Measurements of intensity of the spectral lines of gas (H2 and He) and impurities Visible spectroscopy of the Hydrogen plasma shows a not yet identified (4303 Å) line near the Hg at a count level of about 10-2 of the H The plasma visible light is collected by a telescope and focused onto 1 mm diameter fiber optics Grating 150 g/mm : linear dispersion 13 nm/mm Detector : intensified diode array with 1024 pixels Spectral Resolution : 3 A°/pixel Time resolution : 250 ms Visible Spectroscopy H2 H2 Zoom Enlarged Å Å Very low level of impurities No HeII (4686 Å) : 1 eV <Te 3.5 eV He He zoom Å
Microwave Detector Ie 140 GHz Oscillator Phase Shift Data Aquisition Density Measurements • Microwave Interferometer parameters • Generator Frequency : 140 GHz • Line average density per fringe : 3.4 1018 m-3 Microwave interferometer response HeDischarges - D = 4.0 10-3 mbar Ip=120 A B = 1.25 kG : N = 1.0 1019m-3 B = 0.83 kG : N = 7.0 1018 m-3 B = 0.42 kG : N = 3.4 1018 m-3 Ipinch 0-220 A B = 1.25 kG : N = 1.4 1019m-3
Conical I2 I1 NullField Coils Split Furnace : 400 ºC Winding Tool Vacuum Creep Test Vessel • New Coil Features • Max Exposed Surface • Null Field (Double Winding) • Optimal Weight Balance • No Front Plasma Connector Coil Connection – Conical Hole New Coils & Creep Test Vessel • Short Term Targets • Wind W-Th Coils • Test Conical Connections • Horizontal Creep Test at 2400 ºC • Test New Coil in Proto-Pinch Testbench