Download
1 / 36
380 likes | 472 Views
A Broad-band Radio Attenuation Model for Antarctica and its effect on ANITA sensitivity. By Amir Javaid University of Delaware. Topics. Radio Attenuation in ice and ANITA sensitivity

E N D
A Broad-band Radio Attenuation Model for Antarctica and its effect on ANITA sensitivity By Amir Javaid University of Delaware
Topics Radio Attenuation in ice and ANITA sensitivity Dependence of Radio Attenuation in ice on electrical conductivity and other physical and chemical properties of Antarctic ice Electrical conductivity calculation Attenuation estimation techniques Attenuation model Results Effects of new attenuation model on effective volume estimation
Attenuation in ice and ANITA sensitivity • UHE neutrinos produce Radio pulses when they interact in Antarctic ice • One of ANITA’s goal is to catch these Radio pulses in order to detect UHE neutrinos • UHE neutrino interactions can be very deep inside Antarctic ice • Radio pulses attenuate as they propagate inside ice • Proper understanding of radio attenuation in ice is essential for better detection
Dependence of Radio Attenuation in ice on physical and chemical properties of Antarctic ice For an electromagnetic wave propagating in z direct in a dielectric medium, the Electric Field can be described as The wave number for a dielectric medium can be written as . In the above equation is the attenuation length or the absorption loss which has the following from: The equation for Radio wave attenuation can be written in an approximate form 8.686 Where is weakly dependent on temperature
Carriers of conduction in polar ice • As ice as no electronic current, the carriers of conduction in Pure ice are: • Bjerrum Defects • L-Defects • D-Defects • Ionic Defects • The carriers for impure ice include the additional following carriers • Bjerrum Defects from impurities e.g. and . For Antarctica is only important. • Ions from acids represented by in the grain boundaries (veins) and triple junction. Pure Ice(Physics of ice) Impure ice (MacGregor[2])
Conductivity calculation method (pure ice) The electrical conductivity comprises of two parts The relation for pure ice conductivity is the following In the above relation is the imaginary part of the permittivity. Parameterization reported by Fujita et al[1] is used to calculate given by the following formula The parameters A, B and C for different temperatures are given in table 1. Table 1 [1]
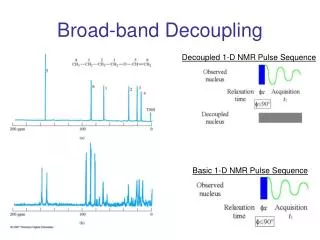
Conductivity calculation method(impure ice) There are two major type of impurities existing is Antarctic ice which are Acids and Sea Salts. The contribution of Acids are represented by [H+ ] ion and sea salt chlorine [ssCl-] ion. The impure part of the conductivity can be written as where The first term in both of these formulae is low frequency band term which is independent of frequency and the second term is the high frequency term which is important for ANITA because its bandwidth maximum ~ 1.2GHz, where the effects high frequency term are important.
Impurity data location maps(ITASE) All impurity locations
Method for conversion from major ions to [H+](acid) and [ssCl-](Sea Salt) [H+] concentration The [H+] concentration can be estimated by the following charge balance equation [H+] = [Cl-] + [NO-3] + 2 [ssSO42-] + [xsSO42-] +[CH3SO-3] - 2 [Ca2+] - [K+]-2 [Mg2+] -[Na+], [ssCl-] concentration The sea salt Chlorine concentration can be calculated by using the of ratios FX of different ionic concentrations with sea salt Sodium ion in sea water. This can be represented as following FX=[ssX]/[ssNa+] The [ssNa+] concentration in the sample is calculated by [ssNa+]sample =min([X]sample/FX) Where [X]sample is the value of ionic concentration of some ion X in the sample. The sea salt concentrations of other ions in the sample can be estimated by the formula FX=[ssX]sample / [ssNa+]sample The non sea salt ionic concentration [xsX]samplecan be calculation by [ssX]sample=[ssX]sample+[xsX]sample
Impurity concentration data • The ITASE data consists of major ions including sodium (Na), magnesium (Mg), calcium (Ca), potassium (K), chloride (Cl), nitrate (NO3), sulphate (SO4), and methane sulfonate(MS).Bertler et al.[4]. • The data includes total of 520 points around Antarctica. For this study 326 points are used because of missing values of some major ion concentrations. To estimate some of the missing data, data fitting has been performed. The plots on the right show the fitting.
IDW method for impurity concentration interpolation This interpolation scheme is based on inverse square radial distance weighting. Impurity concentration for a required point over Antarctica is calculated by using the weighted contributions from all the points with measured impurity data. The weighting scheme can be written as follows
kriging • Kriging is a group of geo-statistical techniques used for estimation of value and variance of the value of a random field at location where there is no data available by using locations with available data. • It is a method based on linear prediction also known as Gauss-Markov estimation or Gaussian regression process. • Major types of Kriging include Simple Kriging, ordinary kriging, cokrigingand some more specialized types. We have used ordinary kriging for the present work. • Application areas of kriging • Environmental science • Black box modeling in computer experiments • Hydrogeology • Mining • Natural resources • Remote sensing
Kriging interpolation method If is our unknown point and for i=0,….N-1 is our input data and denote the variogram between point i and j which is chosen to be of the form . Where is fitted by the un-weighted least squares over all pairs of data and . We can write our input data into the following form So the value of the field and its variance at the point is calculated by
Comparison of IDW and kriging(contd ..) To compare the two models of impurity estimation we have performed an n-1 check. This check involves taking one value out of the data and estimation of that value by using the rest of the data. The results for both IDW and kriging are shown below. It is very clear from these plots that the estimation from kriging is more accurate and it also provides an estimation of error also which is not possible by IDW.
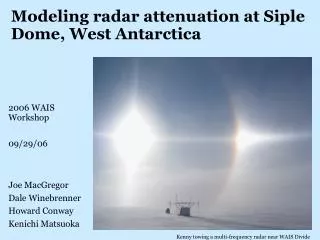
A 3D temperature model has been used for the present study. Data for this model is provided by Dr. James Fastook, University of Maine, extracted from UMISM, the University of Maine Ice Sheet Model, a multi-component model of ice-sheet physics. A detail account of the model, reference and publications can be found at the following website http://tulip.umcs.maine.edu/~shamis/umism/umism.html The interpolation scheme utilized to interpolate between the grid points uses two kinds of weights which are the following Inverse square radial distance weights Inverse square ice thickness difference weights The maximum radial distance used is 200 km and only those profiles are used which has a depth difference of less than 200m from the required location depth. 3D Temperature Model for Antarctica
Comparison of Modeled Temperature profiles with Measured profiles
Attenuation model Results with IDW (1km(max) one way Path attenuation)
Kriging vs IDW(0.6GHz) Full depth bed return power loss Top 1km (max) power loss
Comparison with South Pole and Ross Ice Shelf measurements (Barwick et al [5]) David Saltsburg
Implementation of Kriging attenuation model in icemc • A grid was prepared with (latitude, longitude, depth, frequency). • The grid comprises of 5329 latitude longitude bins, 100 depth bins and 15 frequency bins. • The code calculates attenuation values for only 8 set of frequencies inside the ANITA bandwidth integrated over a vertical direct and reflected ray paths, starting from the point of the origin to the surface. • The values of attenuation for the rest of the frequencies are calculated by linear interpolation. • The estimation of the attenuation grid points are done by the weighted estimation method similar to the one used for temperature estimation.
Comparison of Effective volume*steradians (Kriging vsicemc attenuation)
Icemc run( between icemc and krig attenuation model(direct rays only) Un-weighted Events passing trigger
Comparison of Effective volume*steradians (Kriging vsicemc attenuation)(Reflected Rays only)
Icemc run( between icemc and krig attenuation model(Ref rays only)
Plan Submit the attenuation model paper to Journal of Geophysical research for publication.
References Fujita et al. Physics of Ice Core Records: 185-212 (2000). Joseph A. MacGregor et. al J. Geophys. Res 112 (2007). Matsuoka et al. J. Phys. Chem. B, 101, 6219-6222 (1997). Bertler et al. Ann. Glaciol. 41, 167-179(2004). Barwick et al. J. Glaciol. 51(2007). Numerical Recipes 3rd Edition, Cambridge University Press(2007). Sacks, J. and Welch, W.~J. and Mitchell, T.~J. and Wynn, H.~P. (1989). Design and Analysis of Computer Experiments. 4. Statistical Science. pp. 409–435. HanefiBayraktar and F. Sezer. Turalioglu (2005) A Kriging-based approach for locating a sampling site—in the assessment of air quality, SERRA, v.19, n.4, DOI 10.1007/s00477-005-0234-8, p. 301-305 Chiles, J.-P. and P. Delfiner (1999) Geostatistics, Modeling Spatial uncertainty, Wiley Series in Probability and statistics. Zimmerman, D.A. et al. (1998) A comparison of seven geostatistically based inverse approaches to estimate transmissivies for modeling advectivetransport by groundwater flow, Water Resource. Res., v.34, n.6, p.1273-1413 Tonkin M.J. Larson (2002) Kriging Water Levels with a Regional-Linear and Point Logarithmic Drift, Ground Water, v. 33, no 1., p. 338-353, Journel, A.G. and C.J. Huijbregts (1978) Mining Geostatistics, Academic Press London Andrew Richmond (2003) Financially Efficient Ore Selection Incorporating Grade Uncertainty), Mathematical Geology, v. 35, n.2, p 195-215 Goovaerts (1997) Geostatistics for natural resource evaluation, X. Emery (2005) Simple and Ordinary Kriging Multi-gaussianKriging for Estimating recovevearble Reserves, Mathematical Geology, v. 37, n. 3, p. 295-319) A. Stein, F. van der Meer, B. Gorte (Eds.) (2002) Spatial Statistics for remote sensing