Download
1 / 25
250 likes | 374 Views
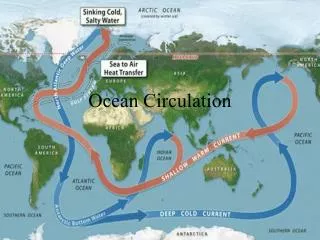
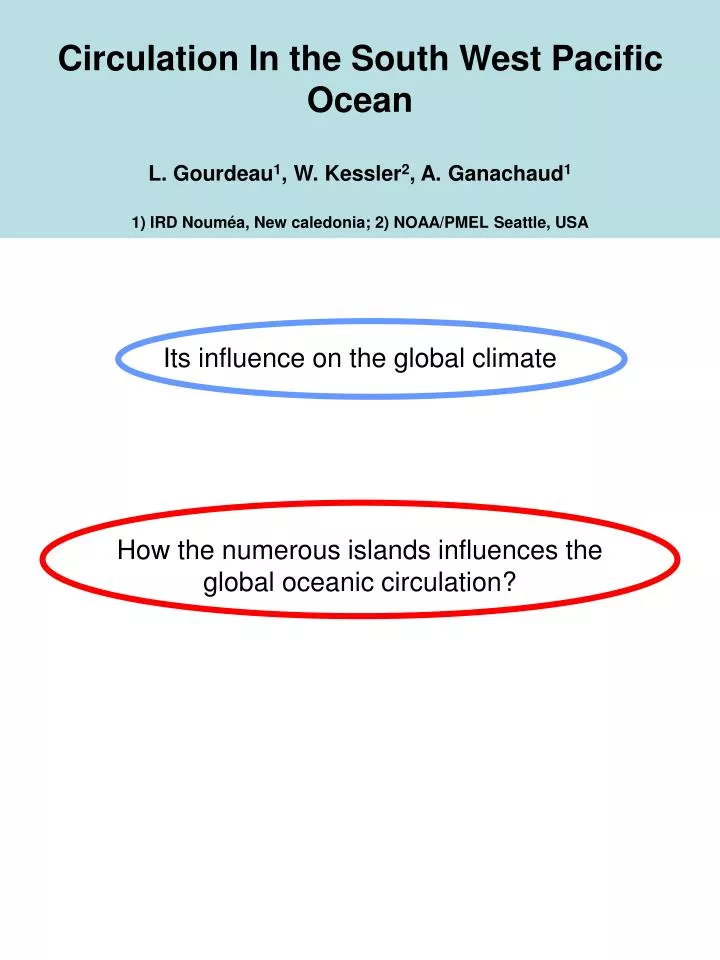
Circulation In the South West Pacific Ocean. Its influence on the global climate How the numerous islands influences the global oceanic circulation?. L. Gourdeau 1 , W. Kessler 2 , A. Ganachaud 1 1) IRD Nouméa, New caledonia; 2) NOAA/PMEL Seattle, USA. Its influence on the global climate.

E N D
Circulation In the South West Pacific Ocean Its influence on the global climate How the numerous islands influences the global oceanic circulation? L. Gourdeau1, W. Kessler2, A. Ganachaud1 1) IRD Nouméa, New caledonia; 2) NOAA/PMEL Seattle, USA
Impact sur le climat grande échelle (Schott et al., 2004) Effet de la topographie
Etat moyen SEC NQC EAC Fonction de courant barotrope (1 E6) SEC Bifurcation sur la côte Australienne Alimentation de l’EAC, du NQC
SEC: Jet Nord Caledonien + Jet Nord Vanuatu 14 S 18 S 161E 0 m 8 cm/s 8 cm/s JNC JNV 1400 m
Bifurcation: Fonction de la profondeur 15°S 95 m 700 m 19°S
Latitude du point de bifurcation 0 m 1400 m 30S 20S 12S
Variabilité Validation
SSHA ORCA/ SLA T/P 165°E ORCA05 T/P
Cycle saisonnier 161°E 6 Sv JNV SEC/2 10 Sv JNC 14 Sv Jan Jui Dec EAC 20 Bif SEC 12 NQC 4
Cycle annuel de la bifurcation 0 m 1400 m Jan Jui Dec 0-300m: de 12°S à 17°S 600-1000m: de 19°S à 24°S
Variabilité Interannuelle JNV JNC 161°E Jets: Pas de variabilité géographique Forte variabilité en intensité
Vitesse zonale à 161°E JNV 0 m 0.1 0. 600 m m/s -0.2 1400 m 1992 1998 2002 JNC 0 m 0.1 0. 600 m m/s -0.2 1400 m
Relation SEC/SOI Relation JNC/JNV C:0.67 (1 an) SEC -16 Sv 16 SOI 1992 1998 2002 JNV C=0.26 -8 Sv 8 JNC
Relations courants d’est / courants de bord ouest SEC C=0.62 NQC+EAC -16 Sv 16 1992 1998 2002 NQC+EAC JNC C=0.85 -8 Sv 8
Relation Bifurcation / Courants de bord ouest 0 m 1000 m 1992 1998 2002 NQC, EAC -8 Sv 8 C=0.24
Bifurcation Fonction de la profondeur 800 m 250 m -4° degree 4° 1992 1998 2002 Faible corrélation entre les couches de surface et les couches profondes C= 0.4 (100/1000 m) 0.72 (100/300 m) 0.95 (700/1000 m)
Relation courants de bord ouest / Bifurcation 8 Bif. 800 m EAC C=0.59 -8 1992 1998 2002 8 NQC Bif. 100 m -8 C=-0.73
Relation courants d’est / Bifurcation 8 SEC 0 <Bif.>z -8 1992 1998 2002 8 JNC 0 Bif. 800 m -8
Corrélation SSH/NQC; SSH/EAC 8 NQC C:-0.74 SSH -8 1992 1998 2002 8 EAC C:-0.76 SSH -8
Conclusion Simulation climatologique « réaliste » • Variabilité saisonnière: • Cycle annuel du JNC et du JNV en opposition de phase Pas de cycle annuel du SEC • Cycle annuel de la bifurcation • EAC et NQC en opposition de phase • Variabilité Interannuelle • Forte variabilité associée à l’ENSO 1997-1998 • Le JNC: La première source d ’alimentation des LLWBCs • Corrélation entre le JNC et la bifurcation • L ’EAC est relié avec la bifurcation en profondeur • Le NQC est relié avec la bifurcation dans les couches supérieures • Signature des anomalies de LLWBCs visible sur la SSH Cause Ondes de Rossby et pompage d’Ekman?? Et Roms?
Cycle saisonnier du rotationnel de vent le long de 20°S-23°S