Download
1 / 52
530 likes | 816 Views
Monopolistic Competition and Oligopoly. CHAPTER 10. © 2003 South-Western/Thomson Learning. Characteristics of Monopolistic Competition. Characteristics Many producers offer products that are either close substitutes but are not viewed as identical

E N D
Monopolistic Competition and Oligopoly CHAPTER 10 © 2003 South-Western/Thomson Learning
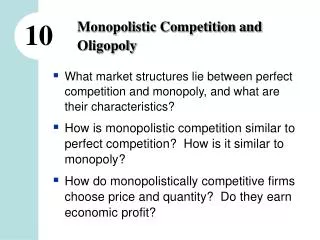
Characteristics of Monopolistic Competition • Characteristics • Many producers offer products that are either close substitutes but are not viewed as identical • Each supplier has some power over the price it charges are price makers • Low barriers to entry firms in the long run can enter or leave the market with ease enough sellers that they behave competitively • Sellers act independently of each other
Product Differentiation • Sellers differentiate their products in four basic ways • Physical differences and qualities • Location • Accompanying services • Product image
Short-Run Profit Maximization or Loss Minimization • Because products are a somewhat different product, each has some control over price each firm’s demand curve slopes downward • Since many firms are selling close substitutes, any firm that raises its price can expect to lose some customers, but not all, to rivals demand is more elastic than a monopolist’s but less elastic than a perfect competitors
Price Elasticity of Demand • The price elasticity of the monopolistic competitor’s demand depends on • The number of rival firms that produce similar products • The firm’s ability to differentiate its product from those of its rivals • A firm’s demand curve will be more elastic the greater the number of competing firms and the less differentiated its product
Marginal Revenue Equals Marginal Cost • The downward-sloping demand curve means that the marginal revenue curve also slopes downward and lies beneath the demand curve • The cost curves are similar to those developed in perfect competition and monopoly • Exhibit 1 depicts the relevant curves for the monopolistic competitor
Exhibit 1a: Profit Maximization In the short run, a firm that can at least cover its variable cost will increase output as long as marginal revenue exceeds marginal cost profits are maximized where marginal revenue equals marginal cost. This occurs at point e. MC b ATC p The profit maximizing price for that quantity is found on the demand curve point b. Average total cost is measured as c which is below the price. Price minus average total cost is the firm’s profit per unit, which, when multiplied by the quantity is economic profit, shown by the blue shaded rectangle. Profit c c D e Dollars per unit MR The monopolistic competitor, like the monopolist, has no supply curve there is no curve that uniquely relates price and quantity supplied. 0 q Quantity per period
Exhibit 1b: Loss Minimization The monopolistic competitor is not assured economic profit. Here the firm’s average total cost curve lies entirely above the demand curve all quantities result in losses the firm must decide whether to shut down temporarily. MC c ATC t i c n Loss u b r p AVC The rule here is the same: as long as the price covers average variable cost, the firm should produce in the short run. Alternatively, it should shut down if no price covers average variable cost. e p s r a D l e l o D The loss-minimization solution is for the firm to produce quantity q and charge the price p. However, since per unit costs are c, the firm incurs a loss shown by the red shaded area. MR 0 q Quantity per period
Zero Economic Profit in the Long Run • Since there are low barriers to entry in monopolistic competition, short-run economic profit will attract new entrants in the long run • Because new entrants offer products that are similar to those offered by existing firms, they draw some customers away from existing firms the demand facing each firm declines and becomes more elastic since there are more substitutes for each firm’s product
Zero Economic Profit in the Long Run • Because of the ease of entry, monopolistically competitive firms earn zero economic profit in the long run • In the cases of losses that persist, some monopolistic competitors will leave the industry their customers will switch to the remaining firms increasing the demand for each remaining firm’s demand curve and making it less elastic • Exhibit 2 shows long-run equilibrium
Exhibit 2: Long-run Equilibrium In the long run, entry and exit will shift each firm’s demand curve until economic profit disappears price equals average total cost. MC ATC This long-run outcome occurs where the marginal revenue curve intersects the marginal cost curve at point a equilibrium q, and the average total cost curve is tangent to the demand curve at point b no economic profit. t i n u r b e p p s r a l l o D a D In the case of short-run losses, some firms will leave the industry the demand curve shifts to the right and become less elastic until the loss disappears and remaining firms earn just a normal profit. MR q 0 Quantity per period
Comparison • How does monopolistic competition compare with perfect competition in terms of efficiency? • In the long run, neither can earn economic profit • However, a difference arises because of the different demand curves facing individual firms in each of two market structures • Exhibit 3 presents the comparison
t i n u r e p s r a l l o D Exhibit 3: Monopolistic Competition Versus Perfect Competition (a) Perfect Competition) (b) Monopolistic Competition MC MC t ATC i n ATC u p' r e d = Marginal revenue= Average revenue p p s r a l l o D D = Average revenue MR 0 q Quantity per period 0 q' Quantity per period Here we are assuming that the two firms have identical cost curves. In each case, the marginal cost curve intersects the marginal revenue curve at the quantity where the average total cost curve is tangent to the firm’s demand curve. The point of tangency between d, MC and ATC in perfect competition implies that the firm is producing at the lowest possible average cost in the long run. In monopolistic competition, the price and average cost, identified as p’ in the right panel, exceed the price and average cost under perfect competition, identified as p in the left panel.
Comparison • Firms in monopolistic competition are said to have excess capacity, since production is lower than the rate that would be associated with the lowest average cost • Alternatively, excess capacity means that each producer could easily produce more and in the process would lower the average cost the marginal value of increased output would exceed its marginal cost greater output would increase economic welfare
Comparison • Another differences is that although the cost curves in the previous exhibit are identical, firms in monopolistic competition spend more on advertising and other promotional expenses to differentiate their products • These higher costs shift up their average cost curves
Comparison • Some argue that monopolistic competition results in too many suppliers and in product differentiation that is often artificial • The counterargument is that consumers are willing to pay a higher price for greater selection • That is, consumers are willing to pay a higher price for greater selection • Consumers benefit from the wider choice
Oligopoly • Oligopoly refers to a market structure that is dominated by just a few firms • Because an oligopoly has only a few firms, each must consider the effect of its own actions on competitors’ behavior the firms in an oligopoly are interdependent • There are a variety of oligopolies
Varieties of Oligopoly • The product can be homogeneous across producers or differentiated across producers • The more homogeneous the products, the greater the interdependence among the few dominant firms in the industry • Products can be differentiated by physical qualities, sales locations, services provided with the product and the image of the product
Varieties of Oligopoly • Because of interdependence among firms in an industry, the behavior of any particular firm is difficult to analyze • Each firm knows that any changes in its product quality, price, output, or advertising policy may prompt a reaction from its rivals • Domination by a few firms can often be traced to some form of barrier to entry
Economies of Scale • Perhaps the most significant barrier to entry is economies of scale • Recall that the minimum efficient scale is the lowest rate of output at which the firm takes full advantage of economies of scale • If a firm’s minimum efficient scale is relatively large compared to industry output, then only one or a few firms are needed to produce the total output demanded in the market • Exhibit 4 presents this situation
t i n u r e p s r a l l o D Exhibit 4: Economies of Scale as a Barrier to Entry Here we have a long-run average cost curve for a typical firm in the industry. a c a If a new entrant sells only S cars, the average cost per unit, ca, far exceeds the average cost, cb, of a manufacturer that sells enough cars to reach the minimum efficiency scale, M. If autos sell for a price less than ca, a potential entrant can expect to lose money. This tends to discourage entry into the industry. b c Long-run average cost b 0 S M Autos per year
High Cost of Entry • The total investment needed to reach the minimum size is often gigantic which may pose another problem for potential entrants into oligopolistic industries • Advertising a new product enough to compete with established brands may also require enormous outlays • High start-up costs and established brand names can create substantial barriers to entry, especially since the fortunes of a new product are so uncertain
High Cost of Entry • Product differentiation expenditures create barriers to entry • Oligopolists often compete with existing rivals and try to block new entry by offering a variety of models and products • Firms often spend billions trying to differentiate their products • Some of these expenditures have the beneficial effects of providing valuable information to consumers and offering them a wide variety of products
Models of Oligopolies • The interdependence of firms in an oligopoly makes analyzing their behavior complicated no one model or approach explains the outcomes • At one extreme, the firms in the industry may try to coordinate their behavior so they act collectively as a single monopolist, forming a cartel • At the other extreme, they may compete so fiercely that price wars erupt
Models of Oligopoly • While there are many theories, we will focus our attention on three of the better-known approaches • Collusion • Price Leadership • Game Theory • Each approach has some relevance, although none is entirely satisfactory as a general theory • Each is based on the diversity of observed behavior in an interdependent market
Collusion • Collusion is an agreement among firms in the industry to divide the market and fix the price • A cartel is a group of firms that agree to collude so they can act as a monopolist and earn monopoly profits • Colluding firms usually reduce output, increase price, and block the entry of new firms
Collusion • Collusion and cartels are illegal in the United States; some other countries are more tolerant and some countries even promote cartels OPEC • Exhibit 5 provides us with an illustration of the impact of firms colluding and forming a cartel
Exhibit 5: Cartel Model • The market demand curve is shown as D. The two key issues are: • what price will maximize the cartel’s profit • how will production be allocated among participating firms? MC p The first task of the cartel is to determine its marginal cost of production. Since the cartel acts as a monopoly operating many plants, the marginal cost curve is the horizontal sum of the marginal cost curves of all firms in the cartel . c Profit maximization occurs where the cartel’s marginal cost curve intersects the market’s marginal revenue curve. This intersection yields price p, industry output Q, and marginal cost of production c. D Dollars per unit MR Quantity per period There is no curve that uniquely relates price and quantity supplied. 0 Q
Cartel Model • To maximize cartel profit, output must be allocated so that the marginal cost for the final unit produced by each firm is identical • Any other allocation would lower cartel profits • However, this is much easier said than done in practice
Differences in Cost • If all firms have identical costs, output and profit are easily allocated across firms each firm produces the same quantity • However, if costs differ, as is normally the case, problems arise • The greater the differences in average costs across firms, the greater will be the differences in economic profits among firms
Differences in Cost • If cartel members try to equalize each firm’s total profit, a high-cost firm would need to sell more than a low-cost firm • But this allocation scheme violates the cartel’s profit-maximizing condition of finding the output for each firm that results in identical marginal costs across firms if average costs differ across firms, the output allocation that maximizes cartel profit will yield unequal profit across cartel members
Number of Firms in the Cartel • The more firms in the industry, the more difficult it is to negotiate an acceptable allocation of output among them • Consensus becomes harder to achieve as the number of firms grows the greater the chances are that one or more will become dissatisfied with the cartel and break the agreement
New Entry Into the Industry • If a cartel cannot block the entry of new firms into the industry, new entry will eventually force prices down, squeezing economic profit and undermining the cartel • The profit of the cartel attracts entry, entry increases market supply market price is forced down
Cheating • Perhaps the biggest obstacle to keeping the cartel running smoothly is the powerful temptation to cheat on the agreement • By offering a price slightly below the established price, a firm can usually increase its sales and economic profit • Because oligopolists usually operate with excess capacity, some cheat on the established price
Summary • Establishing and maintaining an effective cartel will be more difficult • If the product is differentiated among firms • If costs differ among firms • If there are many suppliers in the industry • If entry barriers are low, and • If cheating on the agreement becomes widespread
Price Leadership • An informal, or tacit, type of collusion occurs in industries that contain price leaders who set the price for the rest of the industry • A dominant firm or a few firms establish the market price, and other firms in the industry follow that lead, thereby avoiding price competition • Price leader also initiates price changes
Price Leadership • Obstacles in price leadership industries • The practice usually violates U.S. antitrust laws • The greater the product differentiation among sellers, the less effective price leadership will be as a means of collusion • There is no guarantee that other firms will follow the leader if other firms do not follow, the leader risks losing sales • Some firms will try to cheat on the agreement by cutting price to increase sales and profits • Unless there are barriers to entry, a profitable price will attract entrants
Game Theory • Game theory examines oligopolistic behavior as a series of strategic moves and countermoves among rival firms • It analyzes the behavior of decision-makers, or players, whose choices affect one another • Provides a general approach that allows us to focus on each player’s incentives to cooperate or not
Prisoner’s Dilemma • Two thieves, Ben and Jerry, are caught near the scene of a robbery • The police believe they are guilty but they need a confession • Each thief faces a choice of confessing or denying any knowledge of the crime • If only one confesses he is granted immunity and goes free other gets the maximum of 10 years • If both deny the crime, each gets a 1-year sentence and if both confess, each gets 5 years
Prisoner’s Dilemma • What will each do? • The answer depends on the assumptions about their behavior that is, what strategy each pursues • A strategy reflects a player’s game plan • In the prisoner’s dilemma, each player tries to save his own skin by minimizing his time in jail, regardless of what happens to the other • Exhibit 6 shows the payoff matrix for the game
Payoff Matrix • Payoff matrix is a table listing the rewards or penalties that each can expect based on the strategy that each pursues • Each prisoner pursues one of two strategies, confessing or clamming up • Ben’s strategies are shown along the left margin and Jerry’s across the top • The numbers in the matrix indicate the prison sentence in years for each based on the corresponding strategies
Payoff Matrix • The number above the diagonal shows Ben’s sentence in years and the number below the diagonal show Jerry’s sentence • What strategies are rational assuming that each player tries to minimize jail time? • Ben’s perspective: you know that Jerry will either confess or clam up. Suppose Jerry confesses, if you confess also, you both get 5 years, but if you deny involvement you get 10 years while Jerry walks if Ben thinks Jerry will confess, he should also
Exhibit 6: Payoff Matrix J E R R Y ConfessClam Up If Jerry clams up and Ben confesses, Ben gets no time, but if Ben clams up too, each get one year in jail if Ben thinks that Jerry will clam up, he is better off confessing. 0 5 Confess B E N 10 5 10 1 In short, whatever Jerry does, Ben is better off confessing. The same incentives hold for Jerry he is better off confessing, regardless of what Ben does. Clam Up 0 1 Each has an incentive to confess and both get 5 years. This is called the dominant-strategy equilibrium of the game because each player’s strategy does not depend on what the other does. Notice that if each thief would clam up, both would be better off because they would get only 1 year in jail if Ben and Jerry trust each other to clam up, they would adopt this strategy.
Price Setting Game • The prisoner’s dilemma applies to a broad range of economic phenomena such as pricing policy and advertising strategy • Consider the market for gasoline in a rural community with only two gas stations a duopoly • Suppose customers are indifferent between the two brands and consider only the price
Price Setting Game • Each station sets its daily price early in the morning before knowing the price set by the other • Suppose only two prices are possible a low price and a high price • If both charge the low price, they split the market and each earns a profit of $500 per day • If both charge the high price, they also split the market and earn $700 profit • If one charges the high price but the other the low one, the low price station earns a profit of $1,000 and the other $200
Exhibit 7: Price-Setting Payoff Matrix • Texaco’s strategy is shown down the left-hand margin and Exxon’s across the top. Texaco’s profit appears above the diagonal, and Exxon’s below it. • What price would each charge to maximize profits? • Texaco’s perspective: • If Exxon charges the low price, Texaco earns $500 charging the low price but only $200 by charging the high price better off by charging the low price. • If Exxon charges the high price, Texaco earns $1,000 by charging the low price and $700 charging the high price earn more by charging the low price. • Exxon faces the same incentives • Each seller will charge the low price, regardless of what the other does each earns $500 a day Exxon Low Price High Price $1000 $500 Low Price $500 $200 Texaco $200 $700 High Price $1000 $700
Price Setting Game • If each firm thinks other firms in the cartel will stick with their quotas, they can increase their profits by cutting price and increasing quantities • If you think other firms will cheat and overproduce, they you should too • Either way your incentive as a cartel member is to cheat on the quota
One-Shot versus Repeated Games • The outcome of a game often depends on whether it is a one-shot game or the repeated game • The classic prisoner’s dilemma is a one-shot game the game is to be played only once • However, if the same players repeat the prisoner’s dilemma, as would likely occur in the price setting game, other possibilities unfold
One-Shot versus Repeated Games • In a repeated-game setting, each player has a chance to establish a reputation for cooperation and thereby can encourage the other player to do the same • The cooperative solution makes both players better off than if they fail to cooperate
Tit-for-Tat Strategy • Experiments show that the strategy with the highest payoff in repeated games turns out to be the tit-for-tat strategy • You begin by cooperating in the first round of play • On every round thereafter you cooperate if the other player cooperated in the previous round, and you cheat if your opponent cheated in the previous round