Download
1 / 21
210 likes | 213 Views
Explore the capabilities of microfluorescence imaging and tomography for elemental mapping and oxidation state analysis in earth and environmental sciences. This technique allows for high precision and accuracy in quantitative analysis and can be combined with other x-ray micro-techniques for complementary information on a sample.

E N D
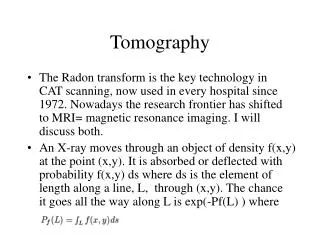
Microfluorescence Imaging and Tomography Matt Newville, Steve Sutton, Mark Rivers, Peter Eng GSECARS, Sector 13, APS The University of Chicago • GSECARS beamline and microprobe station, Kirkpatrick-Baez mirrors • 2 dimensional elemental mapping • 2 dimensional oxidation state mapping • x-ray fluorescence tomography GeoSoilEnviroCARS l The University of Chicago l Argonne National Lab
The GSECARS Fluorescence Microprobe Station The GeoSoilEnviroCARS beamline 13-IDC provides a micro-beam facility for x-ray fluorescence (XRF) and x-ray absorption spectroscopy (XAS) studies in earth and environmental sciences. Sample x-y-z stage: 0.1mm step sizes Horizontal and Vertical Kirkpatrick-Baez focusing mirrors Fluorescence detector: multi-element Ge detector (shown), Lytle Chamber, Si(Li) detector, or Wavelength Dispersive Spectrometer Optical microscope (10x to 50x) with video system GeoSoilEnviroCARS l The University of Chicago l Argonne National Lab
Kirkpatrick-Baez focusing mirrors The table-top Kirkpatrick-Baez mirrors use a four-point bender and a flat, trapezoidal mirror to dynamically form an ellipsis. They can focus a 300x300mm monochromatic beam to 1x1mm - a flux density gain of 105. With a typical working distance of 100mm, and an energy-independent focal distance and spot size, they are ideal for micro-XRF and micro-EXAFS. We routinely use Rh-coated silicon (horizontal) and fused-silica (vertical) mirrors to produce 4x4mm beams for XRF, XANES, and EXAFS. GeoSoilEnviroCARS l The University of Chicago l Argonne National Lab
X-ray Fluorescence Microprobe Experiment: Measure characteristic x-ray emission lines from de-excitation of electronic core levels for each atom. Key Attributes: Element Specific: all elements (with Z>16 or so) can be seen at the APS, and it is usually easy to distinguish different elements. Quantitative: relative abundances of elements can be made with high precision and accuracy. x-ray interaction with matter well understood. XANES/XAFS/XRD combination: can be combined with other x-ray micro-techniques to give complementary information on a sample Low Concentration: concentrations down to a few ppm can be seen. Natural Samples: samples can be in solution, liquids, amorphous solids, soils, aggregrates, plant roots, surfaces, etc. Small Spot Size: measurements can be made on samples down to a few microns in size. GeoSoilEnviroCARS l The University of Chicago l Argonne National Lab
X-ray Fluorescence detector: Solid-State Ge Detector Ge solid-state detectors give energy resolutions down to ~250 eV to separate fluorescence from different elements, and allow a full fluorescence spectrum (or the windowed signal from several elements) to be collected in seconds. Ge detectors are also limited in total count rate (up to ~100KHz), so multiple elements (~10) are used in parallel. Using such detectors gives detection limits at or below the ppm level, and allows XANES and EXAFS measurements of dilute species in heterogeneous environments. GeoSoilEnviroCARS l The University of Chicago l Argonne National Lab
2D XRF Mapping: Pu sorbed toYucca Mountain Tuff Martine Duff, Doug Hunter, Paul Bertsch (Savannah River Ecology Lab, U Georgia) Matt Newville, Steve Sutton, Peter Eng, Mark Rivers (Univ of Chicago) A natural soil sample from the proposed Nuclear Waste Repository at Yucca Mountain, NV, was exposed to an aqueous solution of 239Pu (~1mM). Fluorescence Mapsof 150mm X 150mm areas were made with a 4x7mm x-ray beam from the GSECARS microprobe. Mn, Fe, As, Pb, Sr, Y, and Pu fluorescence were measured simultaneously using a solid-state (Si/Li) detector. The Pu was seen to behighly correlated with Mn-rich minerals in the zeolite- and quartz-rich material, and not with the zeolites, quartz, or Fe-rich minerals. XANES and EXAFS measurements were made at the Pu LIII edge of “hot spots” A1 and A2 …. GeoSoilEnviroCARS l The University of Chicago l Argonne National Lab
XANES and EXAFS: Pu sorbed to Yucca Mountain Tuff XANES features showed the Pu to be in either Pu4+ or Pu5+ (or a mixture of the 2) but not Pu6+. Further measurements (planned for Fall 1999) should help distinguish these two states. Since the initial Pu solution had Pu5+ and since the Mn-rich minerals were dominated by Mn4+, both are plausible. The Extended XAFS (with oscillations isolated from atomic-like background, and then Fourier transformed to show a radial distribution function) shows Pu coordinated by 6--8 oxygens at ~2.26A in the first shell, consistent with Pu4+ or Pu5+ (but again not Pu6+). No reliable second shell could be seen from this data, probably indicating several different Mn second shell distances -- the Pu appears to be weakly bound to the disordered Mn minerals (more measurements needed). GeoSoilEnviroCARS l The University of Chicago l Argonne National Lab
Low Concentration/Small Spot XRF Maps: Pb sorbed to alumina/biofilm A. Templeton, G. E. Brown, Jr. (Stanford Univ) Microscopic organisms in natural systems can alter the chemical and physical state of mineral-water interfaces. It is likely that sorption properties of metal ions is dramatically altered by the presence of microbial biofilms. Pb sorbed onto a biofilm of the bacterium Burkholderia cepacia grown on an a-Al2O3 was studied by mapping the distribution of Pb sorbed to biofilm-coated minerals, so as to correlate Pb-speciation from bulk XANES/EXAFS (from SSRL) with location (mineral surface, cells, etc). Due to the very low Pb concentrations and small features, high-quality fluorescence micro-XAFS from these samples is quite challenging, but possible. GeoSoilEnviroCARS l The University of Chicago l Argonne National Lab
Oxidation state maps: Mn redox at plant roots and hyphae D. Schulze (Purdue Univ) Collecting Mn fluorescence at selected incident energies around the Mn K-edge, we can make 3-d (X-Y-E) maps that give the spatial distribution of different Mn valence states. Manganese is an essential nutrient in plants, needed for physiological processes including photosynthesis and for response to stress and pathogens. Reduced Mn2+ is soluble and bio-available in soils, but oxidized Mn4+ precipitates (along with Mn3+) as insoluble Mn oxides. The redox chemistry of Mn in soil is complex, with both reduction and oxidation catalyzed by microorganisms. Spatially-resolved, micro-XANES is well-suited for mapping Mn oxidation state in live plant rhizospheres in an attempt to better understand the role of Mn redox reactions in a plant’s ability to take up toxic trace elements. XRF image of total Mn concentration (left) of soil traversed by a sunflower root (dashed line) showing the heterogeneous distribution of Mn, with enrichment near the root. The Mn oxidation state map of this same region (right) shows both Mn2+ and Mn4+ in the Mn-rich sites, with a tendency for the reduced species to concentrate near the root. GeoSoilEnviroCARS l The University of Chicago l Argonne National Lab
Detector Resolution: Solid State Detectors Revisited The energy resolution of solid-state detectors (200 eV at best, often limited to count rates to ~1KHz), is sometimes not good enough -- especially with heterogeneous samples with many nearby fluorescence lines. Solid state detectors are also limited in total count rate (up to ~100KHz per element, but at the worst resolution), which can be a problem -- especially with intense x-ray beams. XRF spectra for a synthetic glass containing several rare-earth elements using both a Si(Li) detector and a Wavelength Dispersive Spectrometer. Data collected at NSLS X-26A, Steve Sutton and Mark Rivers. GeoSoilEnviroCARS l The University of Chicago l Argonne National Lab
Wavelength Dispersive Spectrometer (WDS) The Wavelength Dispersive Spectrometer uses an analyzer crystal on a Rowland circle to select a fluorescence line. This has much better resolution (down to ~30eV) than a solid state detector (~250eV), doesn’t suffer dead-time from electronics, and often has superior peak-to-background ratios. The solid-angle and count-rates are lower, and multiple fluorescence lines cannot be collected during mapping. Sample and x-y-z stage Table-top slits Ion chamber Kirkpatrick-Baez focusing mirrors Optical microscope Wavelength Dispersive Spectrometer GeoSoilEnviroCARS l The University of Chicago l Argonne National Lab
Using the WDS for XRF Mapping: Cs on biotite J. McKinley, J. Zachara, S. M. Heald (PNNL) Biotitie is a mica that contains trace amounts of many transition metals, a few percent Ti, and major components of Ca and Fe. To study how Cs would bind to the surface and inner layers of biotite, McKinley and Zachara exposed natural mica to a Cs-rich solution, embedded the mica in epoxy resin and cut cross-sections through the mica. 1000 x 200mm image of the Cs La line in biotite with a 5x5mm beam, 5mm steps and a 2s dwelltime at each point. The incident x-ray energy was 7KeV. Detecting the Cs La fluorescence line is complicated by the nearby Ti Ka line. A high resolution fluorescence detector such as the WDS can make this easier. GeoSoilEnviroCARS l The University of Chicago l Argonne National Lab
Using the WDS for XRF/XANES: 1000ppm Au in FeAsS Louis Cabri (NRC Canada), Robert Gordon, Daryl Crozier (Simon Fraser), PNC-CAT 1000ppm Au in FeAsS (arsenopyrite): The understanding of the chemical and physical state of Au in arsenopyrite ore deposits is complicated by the proximity of the Au LIII and As K edges and their fluorescence lines. At the Au LIII-edge, As will also be excited, and fluoresce near the Au La line. Even using the WDS, the tail of the As Ka line persists down to the Au La line, and is still comparable to it in intensity. 250x250mm image of the Au La line in arsenopyrite with a 6x6mm beam, 5mm steps and a 2s dwell time at each point. The x-ray energy was 12KeV. GeoSoilEnviroCARS l The University of Chicago l Argonne National Lab
Using the WDS for XANES: 1000ppm Au in FeAsS Louis Cabri (NRC Canada), Robert Gordon, Daryl Crozier (Simon Fraser), PNC-CAT The tail of the As Ka line is still strong at the Au La energy, so using a Ge detector gave the Au LIII edge-step as about the same size as the As K edge-step, and the Au XANES was mixed with the As EXAFS. With the WDS, the As edge was visible, but much smaller, and so the Au XANES was clearer. The Au LIII edge of two different natural samples of FeAsS with the WDS. Both samples had ~1000ppm of Au. We see clear evidence for metallic and oxidized Au in these ore deposits. As K-edge 11.868 KeV As Ka line 10.543 KeV Au LIII-edge 11.918 KeV Au La line 9.711 KeV GeoSoilEnviroCARS l The University of Chicago l Argonne National Lab
Fluorescence Tomography: Overview Conventional x-ray computed microtomography (CMT) provides 3D images of the x-ray attenuation coefficient within a sample using a transmission detector. Element-specific imaging can be done by acquiring transmission tomograms above and below an absorption edge, or by collecting the characteristic fluorescence of the element. Fluorescent x-ray tomography is done as first-generation mode tomography, using a pencil-beam scanned across the sample for several angular setting. The sample is rotated around w, and the scan of x is repeated. Tranmission x-rays are can be measured as well to give an overall density. Characteristics: • can collect multiple fluorescense lines at a time. • data collection is relatively slow. • fluorescense can be complicated by self-absorption. • sample size limited by total absorption length . GeoSoilEnviroCARS l The University of Chicago l Argonne National Lab
Fluorescence Tomography: Experimental Setup Optical microscope, KB mirrors Fluorescence detector: multi-element Ge detector Sample Sample stage: x-y-z-q GeoSoilEnviroCARS l The University of Chicago l Argonne National Lab
Fluorescence Tomography: Sinograms The Raw fluorescence tomography data consists of elemental fluorescence (uncorrected for self-absorption) as a function of position and angle: a sinogram. This data is reconstructed as a virtual slice through the sample by a coordinate transformation of (x,w) -> (x, y). The process can be repeated at different z positions to give three-dimensional information. Fluorescence Sinograms for Zn, Fe, and As collected simultaneously for a section of contaminated root (photo, right): x: 300mm in 5mm steps w: 180 in 3 steps w As Zn Fe x GeoSoilEnviroCARS l The University of Chicago l Argonne National Lab
Fluorescence Tomography: Distributions of Heavy Metals in Roots S. Fendorf, C. Hansel (Stanford): Toxic Metal Attenuation by Root-borne Carbonate Nodules The role of root-borne carbonate nodules in the attenuation of contaminant metals in aquatic plants is being investigated using a combination of EXAFS, SEM, X-ray microprobe and fluorescence CT. The CT images of a 300 micron root cross section (Phalaris arundinacea) shows Fe and Pb uniformly distributed in the root epidermis whereas Zn and Mn are correlated with nodules. Arsenic is highly heterogeneous and poorly correlated with the epidermis suggesting a non-precipitation incorporation mechanism. Such information about the distribution of elements in the interior of roots is nearly impossible to get from x-y mapping alone: Physically slicing the root causes enough damage that elemental maps would be compromised. photograph of root section and reconstructed slices of fluorescent x-ray CT for selected elements. GeoSoilEnviroCARS l The University of Chicago l Argonne National Lab
Fluorescence Tomography: Interplanetary Dust Particles G. J. Flynn (SUNY, Plattsburgh): Volatile elements in interplanetary dust Interplanetary Dust Particles (IDPs) collected by NASA aircraft from the Earth’s stratosphere allow laboratory analysis of asteroidal and cometary dust. MicroXRF analyses show enrichment of volatile elements, suggesting the particles derive from parent bodies more primitive than carbonaceous chondrites (Flynn and Sutton, 1995). The IDP fluorescence tomography images show that volatile elements (Zn and Br) are not strongly surface-correlated, suggesting that these elements are primarily indigenous rather than from atmospheric contamination GeoSoilEnviroCARS l The University of Chicago l Argonne National Lab
Fluorescence Tomography: Trace Elements in Goffs Pluton Zircons M. McWilliams (Stanford Univ) Fluorescence CT of individual zircon crystals shows the heterogeneities of U, Th, and Y in candidate crystals for U-Pb dating. Zircons from Goffs Pluton (Mojave) have Proterozoic cores and Cretaceous overgrowths. The tomgraphy images for a 150 mm zircon show that the overgrowths are associated with U and Th enrichment. The crystal contains a large void (dark triangular feature). There is also some U and Th "mineralization" within the void that is zirconium-free (compare U and Zr images). The yttrium distribution is quite heterogeneous with a tendency of anti-correlation with Zr, U and Th. Fluorescence CT in such a strongly absorbing sample (nearly all Zr!) is complicated by self-absorption. These reconstructions are the result of a crude correction for self-absorption in the sinograms. GeoSoilEnviroCARS l The University of Chicago l Argonne National Lab
Fluorescence Tomography: Self Absorption in Zr sinogram Uncorrected sinogram (detector viewing from the right) for Zr fluorescence of ZrSiO4. There is significant self-absorption. The simplest self-absorption correction to the sinogram uses a uniform absorption coefficient of the sample, and does a row-by-row correction. This gives a more uniform density across the sinogram and the reconstructed slice. Sinograms and reconstructed slices for Zr fluorescence from zircon: uncorrected (top) and corrected (bottom) for self-absorption. GeoSoilEnviroCARS l The University of Chicago l Argonne National Lab