Download
1 / 23
230 likes | 313 Views
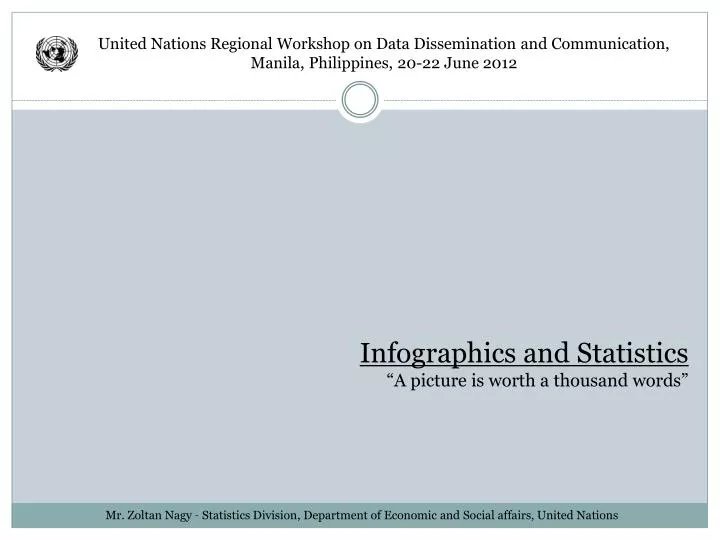
Infographics and Statistics “A picture is worth a thousand words”. United Nations Regional Workshop on Data Dissemination and Communication, Manila, Philippines, 20-22 June 2012. Mr. Zoltan Nagy – Statistics Division, Department of Economic and Social affairs, United Nations. Boring ???.

E N D
Infographics and Statistics“A picture is worth a thousand words” United Nations Regional Workshop on Data Dissemination and Communication, Manila, Philippines, 20-22 June 2012 Mr. Zoltan Nagy – Statistics Division, Department of Economic and Social affairs, United Nations
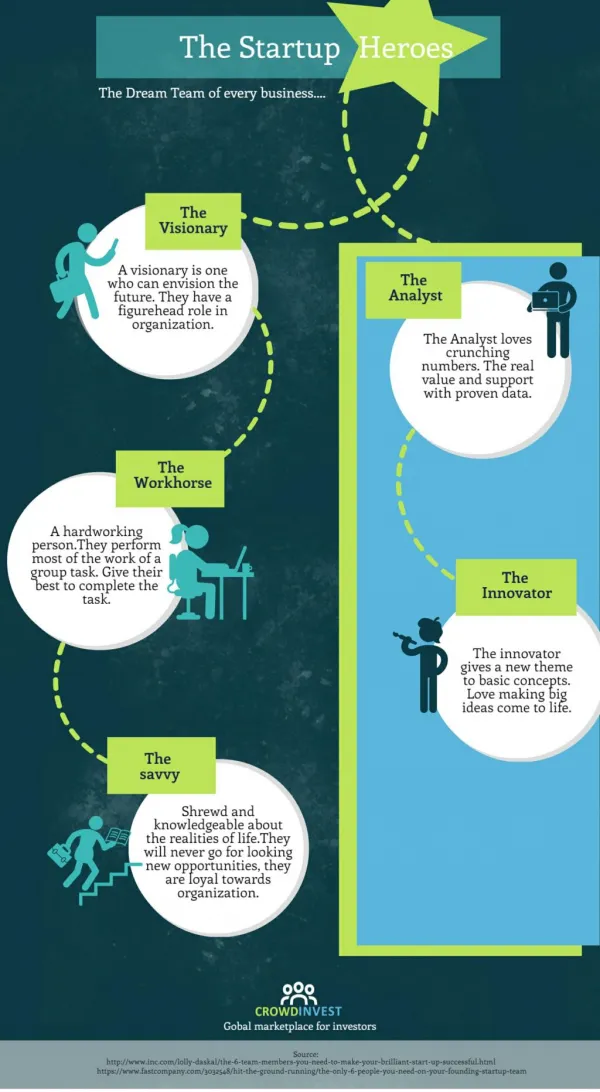
Why Infographics? • Short attention span • Information overload • Easy to understand • Visual retention is better the reading retention • Images are more appealing • People love to share “nice” finds on the Internet
1644 - Michael van Langren • Most likely the first visual representation of statistical data. • 12 determinations of the longitude from Toledo to Rome. Slide 5
1765 - Joseph Priestley • The first timeline Slide 6
1800’s - William Playfair • The ”father” of business graphics Slide 7
1958 – Florence Nightingale • Polar area diagram Slide 8
1858 – Charles Joseph Minard • Combination of maps and piecharts
1869 – Charles Joseph Minard • Presentation of multiple variables on a 2D chart.
1967 – Jacques Bertin • ”Semiology of Graphics” – theoretical foundation of data visualization Slide 11
How to use Infographics? To advocate an issue To show the status of an indicator To illustrate trends To compare indicators To demonstrate correlations
More Tools • http://stephenslighthouse.com/2012/03/23/over-100-incredible-infographic-tools-and-resources-categorized/ • http://www.webadvantage.net/webadblog/30-really-useful-infographic-tools-resources-4453