Download
1 / 10
100 likes | 311 Views
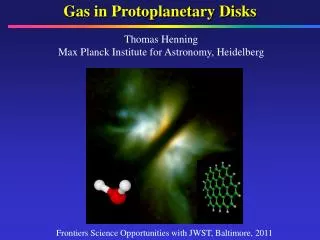
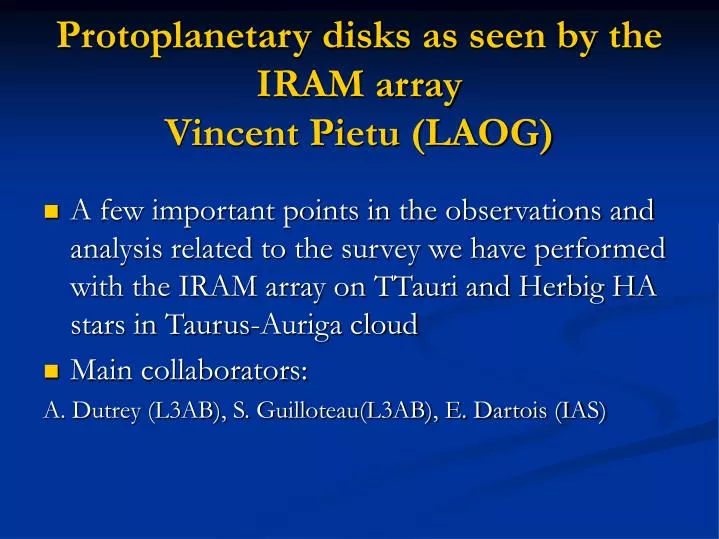
Protoplanetary disks as seen by the IRAM array Vincent Pietu (LAOG). A few important points in the observations and analysis related to the survey we have performed with the IRAM array on TTauri and Herbig HA stars in Taurus-Auriga cloud Main collaborators:

E N D
Protoplanetary disks as seen by the IRAM arrayVincent Pietu (LAOG) • A few important points in the observations and analysis related to the survey we have performed with the IRAM array on TTauri and Herbig HA stars in Taurus-Auriga cloud • Main collaborators: A. Dutrey (L3AB), S. Guilloteau(L3AB), E. Dartois (IAS)
Protoplanetary disks as seen by the IRAM array • Collapse of a prestellar condensation • The conservation of angular momentum gives raise to a flattened structure : disk • Evolutionary sequence : Class 0, I, II, III • Also holds for intermediate-mass stars : Herbig HAe stars (3 < Msun) • Planet formation ?
Disks emission in mm range • Thermalized lines • CO optically thin lines : • J=1-0:Tb a S/T • J=2-1: Tba S CO optically thick lines : • Tb= Tk • Brightness temperatures from a few mK to a few 10 K (12CO J=2-1) • Continuum optically thin : • Tb a M.T • = 0 (ν/ν0) D= 150 pc Res = 1’
Observations and reduction : strategy • 12CO : (u,v) coverage is the limiting factor. • Snapshot observations (better calibration) • Other molecules : SNR is an issue. Can only image brightest disks and strongest lines. • Final error bars on parameters depend on the SNR. • PdBI CO observations : physical structure. • 30-m : line detection. • PdBI : imaging of molecular lines other than CO • Data reduction : flux calibration is an issue ! • Error on Tk proportionnal to flux errors.
Method of analysis : parametric modelling and inversion • Quite complex observations : direct analysis is not possible. Rather use a parametric model. • Need to account for tranfert function of the interferometer for a non-biased analysis. • Since deconvolution is non-linear, comparison performed in the (u,v) plane 2 = i n [ Re(modi,n) - Re(obsi,n)]2 *Wi + i n [ Im(modi,n) - Im(obsi,n)]2 *Wi Weight : Wi = 1 / i2 where i is the thermal noise associated with visibility i • Standard disk model (Pringle 1981): • Power-law parametrisation : • T ( r ) = T0 . (r / r0) -q • S ( r) = S 0 . (r / r0) -p • Vertical distribution derived from (isothermal) hydrostatic equilibrium • n(r,z ) = n(r,0 ) . exp[ - (z / h) 2 ] • Where the scaleheight is : h ( r ) ~ cs / v q • Disk in rotation : v ( r ) = v 0 . (r / r 0) –v (Keplerian case (v=0.5) : dynamical masses measurement : v0 =√ G.M/r0) • Line width : quadratic sum of thernal width and a turburlent width • Level population : Local Thermodynamic Equilibrium (LTE)
CO isotopes analysis : MWC 480 • MWC 480 is a isolated Herbig A4 star. • Observed in 12CO (2-1) 13CO (2-1) and 13CO (1-0) • The modeling reveals a vertical temperature gradient between the plane of the disk (30 K) and above (50 K) at r = 100 AU • Contrary to TTauri stars, CO isotopes are not depleted with respect to TMC-1
Analysis : the (relative) importance of line contamination by continuum • MWC 480 possesses a strong (220 mJy @ 230 GHz) and compact (0.8”) continuum emission (therefore used as an internal flux calibrator). • Can contaminate line wings bias on kinematic properties ! • Solution : simultaneous fitting of line and continuum data (the latter are less noisy thanks to a larger bandwidth) • Indeed, such a procedure provides an better fit to the data. • For example in MWC 480, • 12CO(2-1) :M*= 1.65±0.07 Msol (Simon et al. 2000) Small difference with prestellar evolution models ? Distance problem ? • Same data : M*= 1.97±0.02 Msol (with continum fitting). Perfect agreement with models at the nominal distance
Sub-arcsecond imaging of the Herbig A0e star AB Auriga • Continuum assymetry also present in 13CO • Density effect • Spiral arm ? Fukagawa et al. 2004
AB Aur : modelling and analysis CO lines modelling reveal that • The disk is quite hot, and there is a vertical temperature between the disk plane (30 K) and “atmosphere” (80-100 K) at 100 AU • Contrary to TTauri disks, CO isotopes in HAe disks are not significantly depleted compared to TMC-1 CO abundance . But some difficulties remain : • The rotation is not Keplerian: v(r) = 2.44 (r/ro) 0.4 +\- 0.01 (as derived from 13 CO 2-1, 1-0) • Spiral pattern in the disk Origin of these disturbances ? • Companion ? Quite unlikely. • Massive disk ? Stable according to Toomre’s criterion • Youth remnant ? (Cassen et al. 1981, 1983, Stahler et al. 1994) From Grady et al. 1999
Conclusion and perspective • Millimeter interferometry is a powerful way to study protoplanetary disks, but SNR is an issue • With respect to this concern, the IRAM array is actually the best instrument in use. • Whenever using a model and inversion techniques, it is very useful to compare with observations in the (u,v) plane • mm interferometry provides a reliable and robust access to unique insight onto protoplanetary disks. • In the long term, ALMA will cause a revolution because of • Higher angular resolution (5 AU @ 230 GHz @ 150 pc) • Greater sensitivity • In that perspective, PdBI should be used to prepare ALMA