Download
1 / 1
10 likes | 345 Views
ROB. ASHTEC Z-XII3. ASHTEC UZ-12. ROGUE SNR 8100. ROGUE SNR 8C. Night time scintillation (Kourou, Nov. 2000) (Scintillation level : green [<0.25] orange [0.25-0.5], red [0.5-0.75], violet [ >0.75 ] ). 21h UT. 18h UT. Receiver-type sensitivity. Max. at solar peak and equinox.

E N D
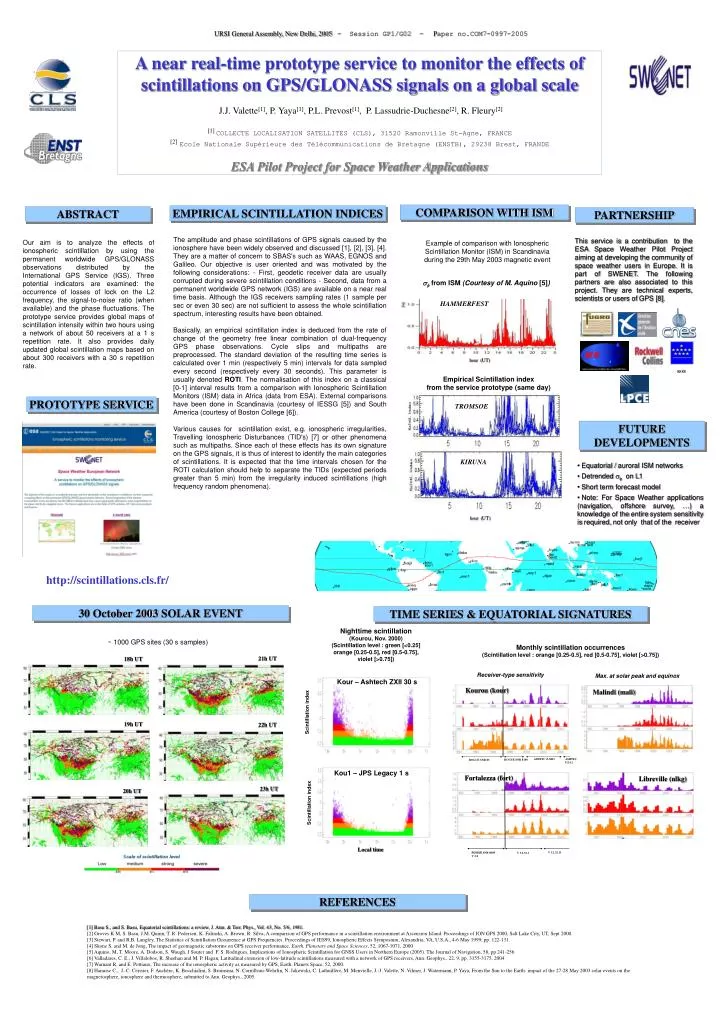
ROB ASHTEC Z-XII3 ASHTEC UZ-12 ROGUE SNR 8100 ROGUE SNR 8C Nighttime scintillation (Kourou, Nov. 2000) (Scintillation level : green [<0.25] orange [0.25-0.5], red [0.5-0.75], violet [>0.75]) 21h UT 18h UT Receiver-type sensitivity Max. at solar peak and equinox Kour – Ashtech ZXII 30 s Kourou (kour) Malindi (mali) Scintillation index 19h UT 22h UT Kou1 – JPS Legacy 1 s Fortalezza (fort) Libreville (nlkg) V 3.2.32.11 ROGUE SNR 8000 V 2.8 V 3.2.32.1 23h UT 20h UT Scintillation index Local time URSI General Assembly, New Delhi, 2005 - Session GP1/G02 - Paper no.COM7-0997-2005 A near real-time prototype service to monitor the effects of scintillations on GPS/GLONASS signals on a global scale J.J. Valette[1], P. Yaya[1], P.L. Prevost[1], P. Lassudrie-Duchesne[2], R. Fleury[2] [1] COLLECTE LOCALISATION SATELLITES (CLS), 31520 Ramonville St-Agne, FRANCE [2]Ecole Nationale Supérieure des Télécommunications de Bretagne (ENSTB), 29238 Brest, FRANDE ESA Pilot Project for Space Weather Applications COMPARISON WITH ISM EMPIRICAL SCINTILLATION INDICES ABSTRACT PARTNERSHIP The amplitude and phase scintillations of GPS signals caused by the ionosphere have been widely observed and discussed [1], [2], [3], [4]. They are a matter of concern to SBAS's such as WAAS, EGNOS and Galileo. Our objective is user oriented and was motivated by the following considerations: - First, geodetic receiver data are usually corrupted during severe scintillation conditions - Second, data from a permanent worldwide GPS network (IGS) are available on a near real time basis. Although the IGS receivers sampling rates (1 sample per sec or even 30 sec) are not sufficient to assess the whole scintillation spectrum, interesting results have been obtained. Basically, an empirical scintillation index is deduced from the rate of change of the geometry free linear combination of dual-frequency GPS phase observations. Cycle slips and multipaths are preprocessed. The standard deviation of the resulting time series is calculated over 1 min (respectively 5 min) intervals for data sampled every second (respectively every 30 seconds). This parameter is usually denoted ROTI. The normalisation of this index on a classical [0-1] interval results from a comparison with Ionospheric Scintillation Monitors (ISM) data in Africa (data from ESA). External comparisons have been done in Scandinavia (courtesy of IESSG [5]) and South America (courtesy of Boston College [6]). Various causes for scintillation exist, e.g. ionospheric irregularities, Travelling Ionospheric Disturbances (TID's) [7] or other phenomena such as multipaths. Since each of these effects has its own signature on the GPS signals, it is thus of interest to identify the main categories of scintillations. It is expected that the time intervals chosen for the ROTI calculation should help to separate the TIDs (expected periods greater than 5 min) from the irregularity induced scintillations (high frequency random phenomena). This service is a contribution to the ESA Space Weather Pilot Project aiming at developing the community of space weather users in Europe. It is part of SWENET. The following partners are also associated to this project. They are technical experts, scientists or users of GPS [8]. Our aim is to analyze the effects of ionospheric scintillation by using the permanent worldwide GPS/GLONASS observations distributed by the International GPS Service (IGS). Three potential indicators are examined: the occurrence of losses of lock on the L2 frequency, the signal-to-noise ratio (when available) and the phase fluctuations. The prototype service provides global maps of scintillation intensity within two hours using a network of about 50 receivers at a 1 s repetition rate. It also provides daily updated global scintillation maps based on about 300 receivers with a 30 s repetition rate. Example of comparison with Ionospheric Scintillation Monitor (ISM) in Scandinavia during the 29th May 2003 magnetic event from ISM(Courtesy of M. Aquino[5]) HAMMERFEST hour (UT) Empirical Scintillation index from the service prototype (same day) PROTOTYPE SERVICE TROMSOE FUTURE DEVELOPMENTS KIRUNA • Equatorial / auroral ISM networks • Detrended on L1 • Short term forecast model • Note: For Space Weather applications (navigation, offshore survey, …) a knowledge of the entire system sensitivity is required, not only that of the receiver hour (UT) http://scintillations.cls.fr/ 30 October 2003 SOLAR EVENT TIME SERIES & EQUATORIAL SIGNATURES ~ 1000 GPS sites (30 s samples) Monthly scintillation occurrences (Scintillation level : orange [0.25-0.5], red [0.5-0.75], violet [>0.75]) REFERENCES [1] Basu S., and S. Basu, Equatorial scintillations: a review, J. Atm. & Terr. Phys., Vol. 43, No. 5/6, 1981.[2] Groves K M, S. Basu, J.M. Quinn, T. R. Pedersen, K. Falinski, A. Brown, R. Silva, A comparison of GPS performance in a scintillation environment at Ascension Island. Proceedings of ION GPS 2000, Salt Lake City, UT, Sept 2000.[3] Stewart, P. and R.B. Langley, The Statistics of Scintillation Occurrence at GPS Frequencies. Proceedings of IES99, Ionospheric Effects Symposium, Alexandria, VA, U.S.A., 4-6 May 1999; pp. 122-131. [4] Skone S. and M. de Jong, The impact of geomagnetic substorms on GPS receiver performance, Earth, Planetary and Space Sciences, 52, 1067-1071, 2000 [5] Aquino, M, T. Moore, A. Dodson, S. Waugh, J Souter and F. S. Rodrigues, Implications of Ionospheric Scintillation for GNSS Users in Northern Europe (2005). The Journal of Navigation, 58, pp 241-256 [6] Valladares, C. E., J. Villalobos, R. Sheehan and M. P. Hagan, Latitudinal extension of low-latitude scintillations measured with a network of GPS receivers, Ann. Geophys., 22, 9, pp. 3155-3175, 2004 [7] Warnant R. and E. Pottiaux, The increase of the ionospheric activity as measured by GPS, Earth. Planets Space, 52, 2000. [8] Hanuise C., J.-C. Cerisier, F. Auchère, K. Bocchialini, S. Bruinsma, N. Cornilleau-Wehrlin, N. Jakowski, C. Lathuillère, M. Menvielle, J.-J. Valette, N. Vilmer, J. Watermann, P. Yaya, From the Sun to the Earth: impact of the 27-28 May 2003 solar events on the magnetosphere, ionosphere and thermosphere, submitted to Ann. Geophys., 2005.