Download
1 / 30
300 likes | 984 Views
BLAST and Psi-BLAST and MSA. Nov. 1, 2012 Workshop-Use BLAST2 to determine local sequence similarities. Homework #6 due Nov 8 Chapter 5, Problem 8 Chapter 6, Problems 1 and 4. What are the different BLAST programs?. blastp

E N D
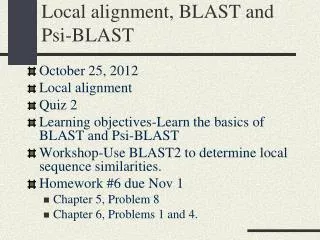
BLAST and Psi-BLAST and MSA • Nov. 1, 2012 • Workshop-Use BLAST2 to determine local sequence similarities. • Homework #6 due Nov 8 • Chapter 5, Problem 8 • Chapter 6, Problems 1 and 4.
What are the different BLAST programs? • blastp • compares an amino acid query sequence against a protein sequence database • blastn • compares a nucleotide query sequence against a nucleotide sequence database • blastx • compares a nucleotide query sequence translated in all reading frames against a protein sequence database • tblastn • compares a protein query sequence against a nucleotide sequence database dynamically translated in all reading frames • tblastx • compares the six-frame translations of a nucleotide query sequence against the six-frame translations of a nucleotide sequence database. Please note that tblastx program cannot be used with the nr database on the BLAST Web page.
What are the different BLAST programs? (continued) • psi-blast • Compares a protein sequence to a protein database. Performs the comparison in an iterative fashion in order to detect homologs that are evolutionarily distant. • blast2 • Compares two protein or two nucleotide sequences.
The E value (false positive expectation value) The Expect value (E) is a parameter that describes the number of “hits” one can "expect" to see just by chance when searching a database of a particular size. It decreases exponentially as the Similarity Score (S) increases (inverse relationship). The higher the Similarity Score, the lower the E value. Essentially, the E value describes the random background noise that exists for matches between two sequences. The E value is used as a convenient way to create a “significance” threshold for reporting results. When the E value is increased from the default value prior to a sequence search, a larger list with more low-similarity scoring hits can be reported. An E value of 1 assigned to a hit can be interpreted as meaning that in a database of the current size you might expect to see 1 match with a similar score simply by chance.
E value (Karlin-Altschul statistics) E = K•m•n•e-λS Where K is a scaling factor (constant), m is the length of the query sequence, n is the length of the database sequence, λ is the decay constant, S is the similarity score. If S increases, E decreases exponentially. If the decay constant increases, E decreases exponentially If m•n increases the “search space” increases. Then there is a greater chance for a random “hit” and E increases. A larger database will increase E. However, larger query sequence often results in a lower E value. Why???
Thought problem A homolog to a query sequence resides in two databases. One is the UniProt database and the other is the PDB database. After performing BLAST search against the UniProt database you obtain an E value of 1. After performing the BLAST search against the PDB database you obtain an E value of 0.0625. What is the ratio of the sizes of the two databases?
Using BLAST to get quick answers to bioinformatics problems (cont.)
Filtering Repetitive Sequences • Over 50% of genomic DNA is repetitive • This is due to: • retrotransposons • ALU region • microsatellites • centromeric sequences, telomeric sequences • 5’ Untranslated Region of ESTs Example of EST with simple low complexity region: T27311 GGGTGCAGGAATTCGGCACGAGTCTCTCTCTCTCTCTCTCTCTCTCTC TCTCTCTCTCTCTCTCTCTCTCTCTCTCTCTCTCTCTCTCTCTCTCTC
Filtering Repetitive Sequences and Masking • Options available for user.
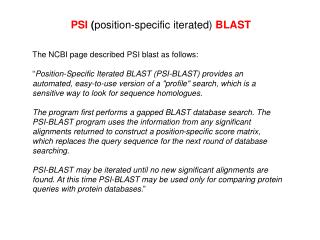
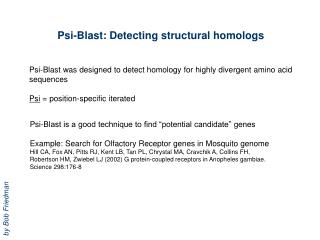
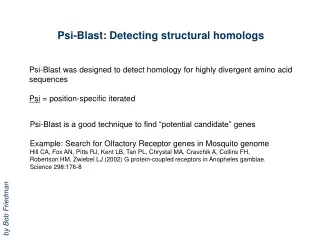
PSI-BLAST • PSI-position specific iterative • a position specific scoring matrix (PSSM) is constructed automatically from multiple HSPs of initial BLAST search. Normal E value threshold is used. • The PSSM is created as the new scoring matrix for a second BLAST search. A low E value threshold is used (E=.001). • Result-1) obtains distantly related sequences 2) finds the important residues that provide function or structure.
Workshop • Is the American crocodile (Crocodylus acutus) more closely related to the sea turtle (Cheloniidae) or to the chicken (Gallus gallus)? Choose mitochondrial ribosomal RNA 12S from each species and compare using blast2. Record percent nucleotide identities, percent similarities and lengths of query/sbjct sequences in your answer.
Multiple Sequence Alignment • Collection of three or more amino acid (or nucleic acid) sequences partially or completely aligned. • Aligned residues tend to occupy corresponding positions in the 3-D structure of each aligned protein.
General steps to multiple alignment. Create Alignment Edit the alignment to ensure that regions of functional or structural similarity are preserved USED FOR: Structure Analysis Find conserved motifs to deduce function Design of PCR primers Phylogenetic Analysis
Practical use of MSA • Helps to place protein into a group of related proteins. It will provide insight into function, structure and evolution. • Identifies sequencing errors • Identifies important regulatory regions in the promoters of genes.
Clustal W (Thompson et al., 1994) • CLUSTAL=Cluster alignment • The underlying concept is that groups of sequences are phylogenetically related. If they can be aligned, then one can construct a phylogenetic tree. • Phylogenetic tree-a tree showing the evolutionary relationships among various biological species or other entities that are believed to have a common ancestor.
Flowchart of computation steps in Clustal W (Thompson et al., 1994) Pairwise alignment: calculation of distance matrix Creation of unrooted neighbor-joining tree Rooted NJ tree (guide tree) and calculation of sequence weights Progressive alignment following the guide tree
Preliminary pairwise alignments Compare each pair of sequences. A - B .87 - C .59 .60 - Different sequences Each number represents the number of exact matches divided by the sequence length (ignoring gaps). Thus, the higher the number the more closely related the two sequences are. A B C In this matrix, sequence A is 87% identical to sequence B
Step 1-Calculation of Distance Matrix Use the Distance Matrix to create a Guide Tree to determine the “order” of the sequences. Hbb-Hu 1 - Hbb-Ho 2 .17 - Hba-Hu 3 .59 .60 - Hba-Ho 4 .59 .59 .13 - Myg-Ph 5 .77 .77 .75 .75 - Gib-Pe 6 .81 .82 .73 .74 .80 - Lgb-Lu 7 .87 .86 .86 .88 .93 .90 - 1 2 3 4 5 6 7 D = 1 – (I) D = Difference score # of identical aa’s in pairwise global alignment I = total number of aa’s in shortest sequence
Myg-Ph Hba-Ho Hba-Hu Hbb-Ho Gib-Pe Hbb-Hu Lgb-Lu Step 2-Create an unrooted NJ tree
Step 3-Create Rooted NJ Tree Weight Alignment Order of alignment: 1 Hba-Hu vs Hba-Ho 2 Hbb-Hu vs Hbb-Ho 3 A vs B 4 Myg-Ph vs C 5 Gib-Pe vs D 6 Lgh-Lu vs E
Step 4-Progressive alignment Scoring during progressive alignment M(t,v) = 0; M(t,i) = -1; M(l,v) = 1; M(l,i) = 2 Following the steps in the above figure, calculation of the score for the comparison of A and B at the outlined position is: 0 * 0.506*0.437 = 0 -1 * 0.506*0.459 = -.232 1 * 0.511 * 0.437 = .223 2 * 0.511 * 0.459 = .469 (0 + (-0.232) + 0.223 + 0.469)/4 = 0.460
Rules for alignment • Short stretches of 5 hydrophilic residues often indicate loop or random coil regions (not essential for structure) and therefore gap penalties are reduced reduced for such stretches. • Gap penalties for closely related sequences are lowered compared to more distantly related sequences (“once a gap always a gap” rule). It is thought that those gaps occur in regions that do not disrupt the structure or function. • Alignments of proteins of known structure show that proteins gaps do not occur more frequently than every eight residues. Therefore penalties for gaps increase when required at 8 residues or less for alignment. This gives a lower alignment score in that region. • A gap weight is assigned after each aa according the frequency that such a gap naturally occurs after that aa in nature
Amino acid weight matrices • As we know, there are many scoring matrices that one can use depending on the relatedness of the aligned proteins. • As the alignment proceeds to longer branches the aa scoring matrices are changed to those more suitable for distant evolutionary relationships. The length of the branch is used to determine which matrix to use and contributes to the alignment score.
Example of Sequence Alignment using Clustal W Asterisk represents identity : represents high similarity . represents low similarity
Multiple Alignment Considerations • Quality of guide tree. It would be good to have a set of closely related sequences in the alignment to set the pattern for more divergent sequences. • If the initial alignments have a problem, the problem is magnified in subsequent steps. • CLUSTAL W is best when aligning sequences that are related to each other over their entire lengths • Do not use when there are variable N- and C- terminal regions • If protein is enriched for G,P,S,N,Q,E,K,R then these residues should be removed from gap penalty list. (what types of residues are these?) Reference: http://www-igbmc.u-strasbg.fr/BioInfo/ClustalW/